. 2010 Oct 22;285(43):32720-32733.
doi: 10.1074/jbc.M110.118406. Epub 2010 Aug 23.

Arachidonic acid-metabolizing cytochrome P450 enzymes are targets of {omega}-3 fatty acids

Affiliations

Arachidonic acid-metabolizing cytochrome P450 enzymes are targets of {omega}-3 fatty acids

Cosima Arnold et al. J Biol Chem. .

Abstract

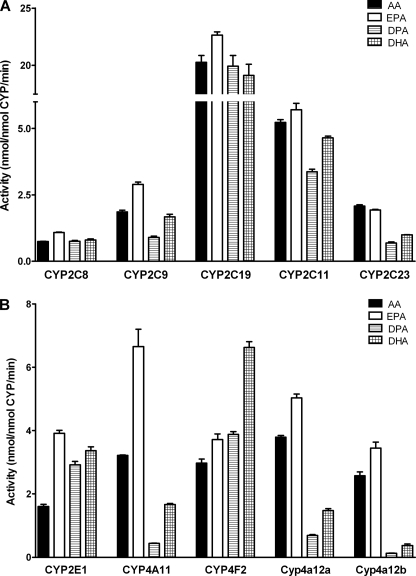
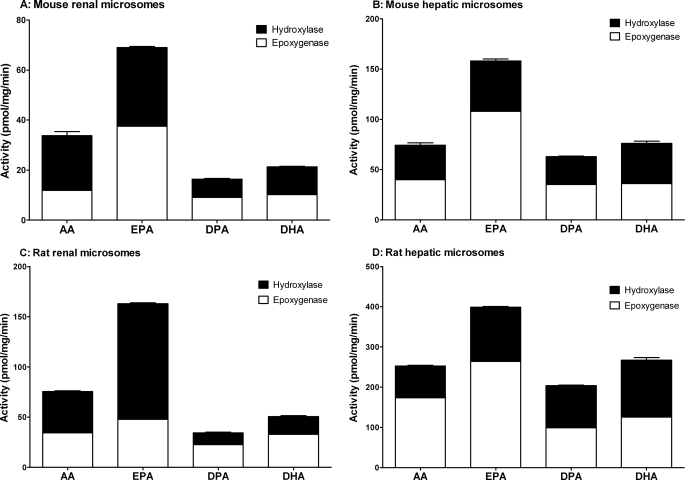
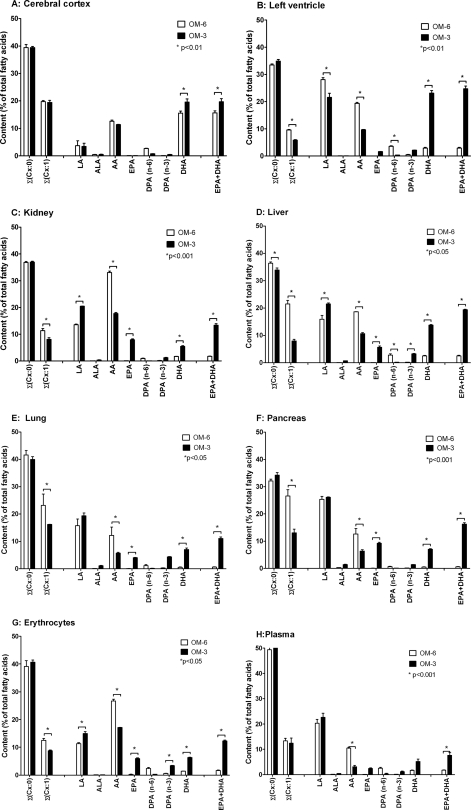
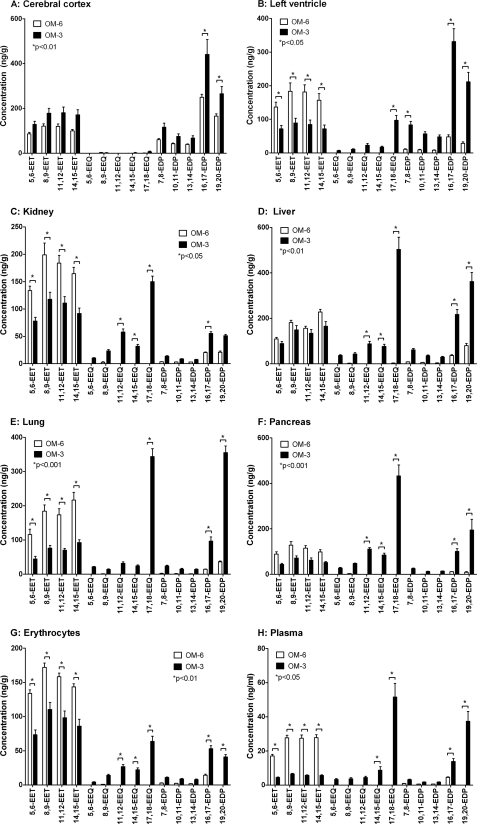
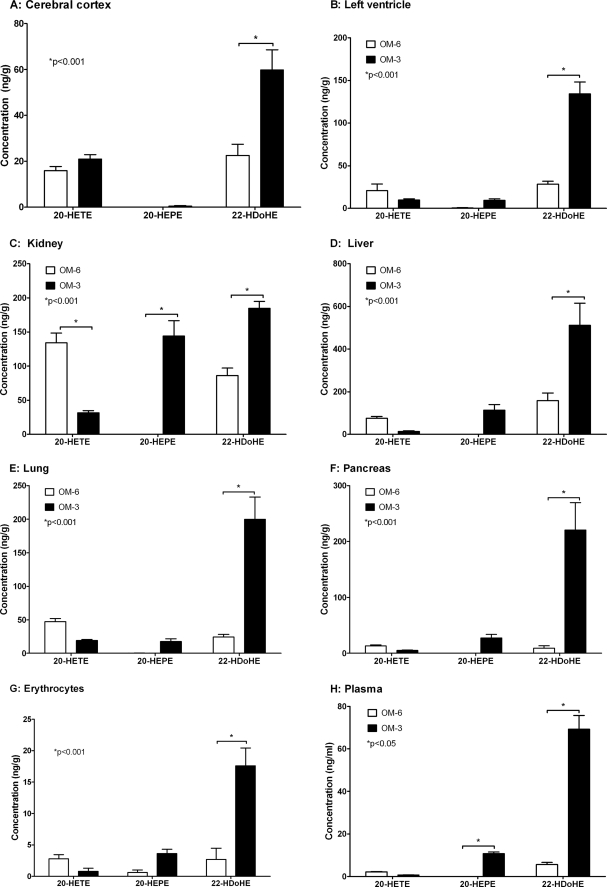
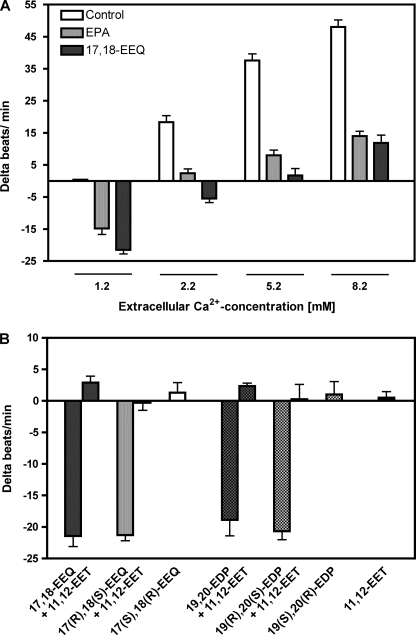
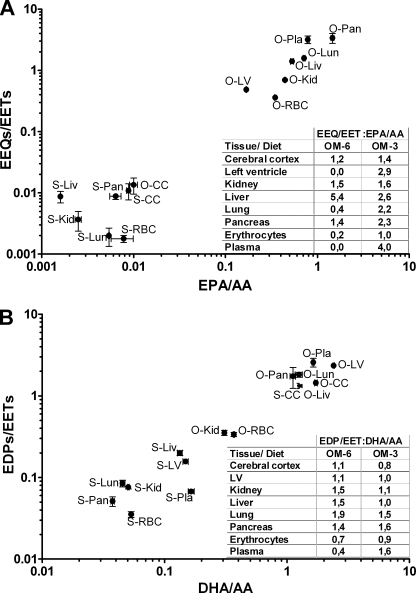
Eicosapentaenoic acid (EPA) and docosahexaenoic acid (DHA) protect against cardiovascular disease by largely unknown mechanisms. We tested the hypothesis that EPA and DHA may compete with arachidonic acid (AA) for the conversion by cytochrome P450 (CYP) enzymes, resulting in the formation of alternative, physiologically active, metabolites. Renal and hepatic microsomes, as well as various CYP isoforms, displayed equal or elevated activities when metabolizing EPA or DHA instead of AA. CYP2C/2J isoforms converting AA to epoxyeicosatrienoic acids (EETs) preferentially epoxidized the ω-3 double bond and thereby produced 17,18-epoxyeicosatetraenoic (17,18-EEQ) and 19,20-epoxydocosapentaenoic acid (19,20-EDP) from EPA and DHA. We found that these ω-3 epoxides are highly active as antiarrhythmic agents, suppressing the Ca(2+)-induced increased rate of spontaneous beating of neonatal rat cardiomyocytes, at low nanomolar concentrations. CYP4A/4F isoforms ω-hydroxylating AA were less regioselective toward EPA and DHA, catalyzing predominantly ω- and ω minus 1 hydroxylation. Rats given dietary EPA/DHA supplementation exhibited substantial replacement of AA by EPA and DHA in membrane phospholipids in plasma, heart, kidney, liver, lung, and pancreas, with less pronounced changes in the brain. The changes in fatty acids were accompanied by concomitant changes in endogenous CYP metabolite profiles (e.g. altering the EET/EEQ/EDP ratio from 87:0:13 to 27:18:55 in the heart). These results demonstrate that CYP enzymes efficiently convert EPA and DHA to novel epoxy and hydroxy metabolites that could mediate some of the beneficial cardiovascular effects of dietary ω-3 fatty acids.


Figures

FIGURE 1.
FIGURE 1.
Metabolisms of AA, EPA, DPA, and DHA by recombinant CYP isoforms functioning predominantly as epoxygenases (A) or hydroxylases (B). The data are mean values ± S.E. (error bars) from at least three determinations done in direct parallel with the four substrates. The specific activities were determined using the 1-14C-labeled substrates at a concentration of 10 μm and refer to total product formation (sum of epoxy and hydroxy metabolites) as analyzed by RP-HPLC; compare Tables 1 and 2 for the detailed regioisomeric composition of the metabolites.
FIGURE 2.
FIGURE 2.
Metabolism of AA, EPA, DPA, and DHA by mouse and rat renal (A and C) and hepatic microsomes (B and D). The data are mean values ± S.E. (error bars) from at least three determinations done in direct parallel using the 1-14C-labeled substrates at a concentration of 10 μm. Hydroxylase activities were calculated from the generated (ω-1)/ω-hydroxy metabolites migrating largely unresolved in RP-HPLC and epoxygenase activities from the sum of regioisomeric epoxides and the corresponding diols.
FIGURE 3.
FIGURE 3.
Effect of dietary EPA/DHA supplementation on the fatty acid composition of different organs and tissues in rat. Male Sprague-Dawley rats (n = 6/group) received for 3 weeks a diet either supplemented with 5% sunflower oil alone (ω-6 fatty acid-rich diet; OM-6 group) or additionally with 2.5% OMACOR® oil consisting of purified EPA- and DHA-ethylesters in a molar ratio of 1.4:1 (OM-3 group). The fatty acid profiles were determined for the harvested organs and tissues (A–H) of three animals per group, and the data represent the corresponding mean values ± S.E. (error bars). For the detailed composition of the diets used, see supplemental Tables 1 and 3 for the complete list of all individual fatty acids determined in the different organs and tissues.
FIGURE 4.
FIGURE 4.
Effect of dietary EPA/DHA supplementation on the profile of AA-, EPA-, and DHA-derived monoepoxides in different organs and tissues of rat. The animals received either an ω-6 fatty acid-rich (OM-6 group) or an EPA/DHA-supplemented diet (OM-3 group) as described in the legend to Fig. 3. AA-derived EETs, EPA-derived EEQs and DHA-derived EDPs were determined by LC-MS/MS in the harvested organs and tissues (A–H) of six animals per group, and the data represent the corresponding mean values ± S.E. (error bars) for the individual metabolites. For a summarized depiction of the changes in total EET, EEQ, and EDP levels, see supplemental Fig. 4.
FIGURE 5.
FIGURE 5.
Effect of dietary EPA/DHA supplementation on the profile of AA-, EPA-, and DHA-derived ω-hydroxy metabolites in different organs and tissues of rat. The animals were fed an ω-6 fatty acid-rich diet (OM-6 group) or an EPA/DHA-supplemented diet (OM-3 group) as described in the legend to Fig. 3. AA-derived 20-HETE, EPA-derived 20-HEPE and DHA-derived 22-HDoHE were determined by LC-MS/MS in the harvested organs and tissues (A–H) of six animals per group, and the data represent the corresponding mean values ± S.E. (error bars) for the individual metabolites.
FIGURE 6.
FIGURE 6.
Effects of EPA and selected epoxy metabolites on spontaneously beating NRCMs. A, incubation of cultured NRCMs with EPA (3.3 μm, 30 min) or 17,18-EEQ (30 nm, 5 min) reduced the beating rate under basal conditions (1.2 mm Ca2+) and attenuated the response to increased extracellular calcium ion concentrations. The vehicle (0.1% ethanol) had no effect on the basal and Ca2+-induced beating rates. B, 17,18-EEQ and 19,20-EDP exerted negative chronotropic effects that were abolished by adding 11,12-EET. Only the R,S- and not the S,R-enantiomers of 17,18-EEQ and 19,20-EDP were active. All metabolites were tested at a final concentration of 30 nm. Data are mean values ± S.E. (error bars) from n = 18–24 cell clusters originating from at least three independent NRCM cultures.
FIGURE 7.
FIGURE 7.
Relative efficiencies of precursor fatty acid to epoxy metabolite conversions. A shows the ratio of total EEQ and EET levels versus the ratio of EPA and AA in the given organs and tissues. B shows the ratio of EDP and EET levels versus the ratio of DHA and AA as the corresponding precursor fatty acid. The calculated data (insets) show that the relative conversions of EPA to EEQs (A) and of DHA to EDPs (B) deviate from that of AA to EETs in a diet- and tissue-specific manner. S, sunflower oil (OM-6) diet; O, OMACOR® oil (OM-3) diet; CC, cerebral cortex; LV, left ventricle of the heart; Liv, liver; Kid, kidney; Lun, lung; Pan, pancreas; RBC, red blood cells; Pla, plasma. Error bars, S.E.

Similar articles

Cited by

References

    1. Capdevila J. H., Falck J. R. (2002) Prostaglandins Other Lipid Mediat. 68, 325–344 - PubMed
    1. Zeldin D. C. (2001) J. Biol. Chem. 276, 36059–36062 - PubMed
    1. Kroetz D. L., Xu F. (2005) Annu. Rev. Pharmacol. Toxicol. 45, 413–438 - PubMed
    1. Campbell W. B., Falck J. R. (2007) Hypertension 49, 590–596 - PubMed
    1. Fleming I. (2008) Trends Cardiovasc. Med. 18, 20–25 - PubMed

Publication types