. 2010 Dec;24(12):4977-88.
doi: 10.1096/fj.10-162941. Epub 2010 Aug 23.

Long-lived mitochondrial (Mit) mutants of Caenorhabditis elegans utilize a novel metabolism

Affiliations

Long-lived mitochondrial (Mit) mutants of Caenorhabditis elegans utilize a novel metabolism

Jeffrey A Butler et al. FASEB J. 2010 Dec.

Abstract

The Caenorhabditis elegans mitochondrial (Mit) mutants have disrupted mitochondrial electron transport chain (ETC) functionality, yet, surprisingly, they are long lived. We have previously proposed that Mit mutants supplement their energy needs by exploiting alternate energy production pathways normally used by wild-type animals only when exposed to hypoxic conditions. We have also proposed that longevity in the Mit mutants arises as a property of their new metabolic state. If longevity does arise as a function of metabolic state, we would expect to find a common metabolic signature among these animals. To test these predictions, we established a novel approach monitoring the C. elegans exometabolism as a surrogate marker for internal metabolic events. Using HPLC-ultraviolet-based metabolomics and multivariate analyses, we show that long-lived clk-1(qm30) and isp-1(qm150) Mit mutants have a common metabolic profile that is distinct from that of aerobically cultured wild-type animals and, unexpectedly, wild-type animals cultured under severe oxygen deprivation. Moreover, we show that 2 short-lived mitochondrial ETC mutants, mev-1(kn1) and ucr-2.3(pk732), also share a common metabolic signature that is unique. We show that removal of soluble fumarate reductase unexpectedly increases health span in several genetically defined Mit mutants, identifying at least 1 alternate energy production pathway, malate dismutation, that is operative in these animals. Our study suggests long-lived, genetically specified Mit mutants employ a novel metabolism and that life span may well arise as a function of metabolic state.


Figures

Figure 1.
Figure 1.
Mit mutants are resistant to both severe oxygen deprivation and hypoxia. A) Wild-type (N2) animals; clk-1(e2519), clk-1(qm30), tpk-1(qm162), lrs-2(mg312), and isp-1(qm150) Mit mutants; mev-1(kn1) and ucr-2.3(pk732) Byby mutants; as well as 3 additional control strains, eat-2(ad465), daf-2(e1370), and balanced animals carrying the lrs-2(mg312) mutation, were collected in S-basal as adult worms, then continuously perfused with 0.05% CO2/N2 inside a sealed chamber for the indicated period of time (abscissa). Percentage survival was scored (120 animals/condition). Strain labels are ordered top to bottom as curves appear left to right. In A–C, Mit mutant strains containing the gst-4::GFP transgene were randomly included as controls for background effects. B) In experiments analagous to those in A, N2, clk-1(qm30), and isp-1(qm150) populations were supplemented with 1mM fumarate, succinate, malate, or glucose, and survival was scored. C) All strains described in A, as well as RNAi-induced nuo-2 Mit mutants, vector-control treated animals, gst-4::gfp transgenics, and age-1(hx546) Daf-c mutants, were tested for resistance to 500 mM sodium azide. One-day-old adults were placed in azide, and the time of last observed movement (LOM) was recorded (n=30 worms/condition). Boxes in both left and right panels delineate 25th–75th percentile. Median and mean are marked by solid and dotted lines, respectively. Whiskers on box indicate 10th and 90th percentiles. Left panel: *strain comparisons with significantly different mean LOM values (P<0.002, ANOVA on rank-transformed data, Fisher least significant difference post hoc test). Strains 6 and 8 are controls for 7 and 9, respectively. Strains 8 and 9 were 2-d-old (d.o.) adults. Right panel: *strain comparisons relative to N2 with significantly different median LOM values (P<0.05, Kruskal-Wallis 1-way ANOVA on rank-transformed data).
Figure 2.
Figure 2.
RNAi-mediated inhibition of soluble fumarate reductase differentially increases Mit mutant life span. Wild-type (N2) animals; isp-1(qm150), tpk-1(qm162), clk-1(e2519), and clk-1(qm30) Mit mutants; and mev-1(kn1) and ucr-2.3(pk732) Byby mutants were cultured on bacterial-feeding RNAi targeting soluble FR (undiluted or 0.1 strength) or on vector control bacteria (Vector) from the time of hatching, and life span was assessed. A) Survival curves (n=60 worms/condition, 0.1 strength sFR is not shown). isp-1 and N2 animals cultured on sFR RNAi were significantly longer and shorter lived, respectively, than their vector control (P<0.05, log-rank test). tpk-1 and clk-1(e2519) approached significance (P<0.15, log-rank test). B) Mean life-span values for each of the assays performed in A. C) clk-1(qm30) survival curves; as in A, except curves are averages of replicate experiments (n=120 worms/per condition). clk-1(qm30) cultured on sFR RNAi is significantly longer-lived than vector control (P<0.001, log rank test). D) Mean ± se life-span values for assays performed in C. *P < 0.05 vs. vector. E, F) Repeat of experiments in A and B, except life-span studies were performed in duplicate and using 25 μM FuDR (n=120 worms/condition). Mean life-span increase of isp-1 and clk-1(qm30) cultured on sFR RNAi relative to vector control trended toward significance (P<0.1). Error bars = se.
Figure 3.
Figure 3.
ucr-2.3(pk732) is a new Byby mutant. Life-span analysis of NL1832 [ucr-2.3(pk732)] and wild-type (N2) worms cultured on standard NGM/OP50 plates (n=84 and 63 worms, respectively; log-rank test, P=2.2×10⁻⁴). Data represent 2 experiments, each performed by a different scorer.
Figure 4.
Figure 4.
HPLC-UV and PCA analysis of excreted metabolites differentiates long-lived Mit mutants from short-lived Byby mutants. A) Excreted metabolites were collected and analyzed from N2 wild-type animals, long-lived isp-1(qm150) and clk-1(qm30) Mit mutants, and short-lived mev-1(kn1) and ucr-2.3(pk732) Byby mutants, using HPLC-UV, as described in Materials and Methods. Metabolites were also collected from N2 animals cultured under severe hypoxia. Representative HPLC-UV traces for each strain/condition are shown. B) A crude measure of metabolic activity in each strain was obtained by integrating the area under each trace and averaging across replicates (means±se). Anerobic N2, isp-1(qm150) and mev-1(kn1) were significantly different from N2. P < 0.05; Student's t test. C) Chromatogram peak areas in each trace were modeled using the pseudovoigt peak-fitting algorithm of the program Fityk. PCA analysis was then performed using R on the set of all peaks, over all strains. Shown is a scree plot of the resulting PCs; 70% of the variance in the excreted metabolite data is captured by the first 3 PCs. D) Plot of PC-1, PC-2, and PC-3 scores for each strain shows that long- and short-lived Mit mutants can be differentiated on the basis of their metabolic end products (solid squares, N2; shaded squares, anaerobic N2; solid circles, clk-1(qm30); shaded circles, isp-1(qm150); solid triangles, mev-1(kn1); shaded triangles, ucr-2.3(pk732).
Figure 5.
Figure 5.
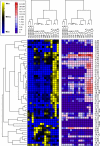
Hierarchical clustering confirms PCA results. A hierarchical clustering approach that was insensitive to differences in peak profile magnitude (see Materials and Methods) yielded an identical strain clustering pattern as that derived using PCA. Data are presented as 2 heat maps showing results scaled on the basis of relative metabolite abundance across samples (left panel, blue–yellow) or on the basis of globally relative metabolite abundance (right panel, blue–red). Inset illustrates scales. Branches at top and left of figure illustrate clustering hierarchies derived using data in right panel.
Figure 6.
Figure 6.
Identity of metabolites driving Mit and Byby mutant separation in the PCA. A) HPLC-UV peak loadings for PC-1, PC-2, and PC-3. Peaks are identified on the basis of their retention time (minutes, abscissa). Loading value magnitude reflects the degree a peak contributes to the listed PC (absolute value of 1=completely; 0=no contribution). Positive and negative loading values indicate opposing contributions to PC score. HPLC-UV peaks showing large absolute loading values were collected from clk-1(qm30) or mev-1(kn1) mutants for metabolite identification. Asterisks indicate 2.60- and 3.84-min peaks.B) Long-lived mutants differentially excrete pyruvate (2.60 min, arrow). Shown is a HPLC-UV trace before (gray) and after (black) incubation of clk-1 exometabolome with NADH and lactate dehydrogenase. C) Peak at 3.84 min is enriched in Byby mutants. ESI-MS fragmentation patterns match lactate, a-ketoglutarate, and the dipeptide Gly-Pro (m/z 89.0, 145.0 n, and 171.0, respectively).

Similar articles

Cited by

References

    1. Dillin A., Hsu A.-L., Arantes-Oliveira N., Lehrer-Graiwer J., Hsin H., Fraser A. G., Kamath R. S., Ahringer J., Kenyon C. (2002) Rates of behavior and aging specified by mitochondrial function during development. Science 298, 2398–2401 - PubMed
    1. Lee S. S., Lee R. Y., Fraser A. G., Kamath R. S., Ahringer J., Ruvkun G. (2003) A systematic RNAi screen identifies a critical role for mitochondria in C. elegans longevity. Nat. Genet. 33, 40–48 - PubMed
    1. Rea S. L., Ventura N., Johnson T. E. (2007) Relationship between mitochondrial electron transport chain dysfunction, development, and life extension in Caenorhabditis elegans. PLoS Biol. 5, e259. - PMC - PubMed
    1. Rea S. L. (2005) Metabolism in the Caenorhabditis elegans Mit mutants. Exp. Gerontology 40, 841–849 - PubMed
    1. Ventura N., Rea S. L. (2007) Caenorhabditis elegans mitochondrial mutants as an investigative tool to study human neurodegenerative diseases associated with mitochondrial dysfunction. Biotechnology J. 2, 584–595 - PubMed

Publication types

MeSH terms

Substances

LinkOut - more resources