

Disruption of the gene for CYP1A2, which is expressed primarily in liver, leads to differential regulation of hepatic and pulmonary mouse CYP1A1 expression and augmented human CYP1A1 transcriptional activation in response to 3-methylcholanthrene in vivo
- PMID: 20732958
- PMCID: PMC2967398
- DOI: 10.1124/jpet.110.171173
Disruption of the gene for CYP1A2, which is expressed primarily in liver, leads to differential regulation of hepatic and pulmonary mouse CYP1A1 expression and augmented human CYP1A1 transcriptional activation in response to 3-methylcholanthrene in vivo
Abstract
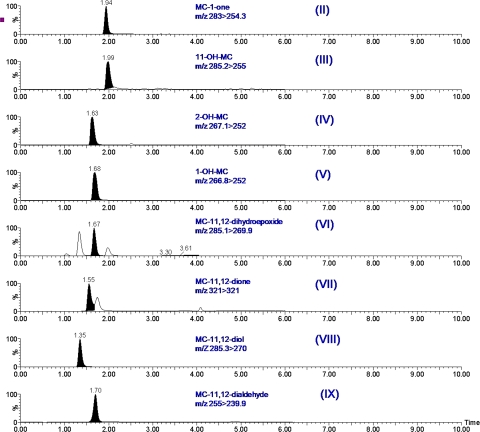
The cytochrome P4501A (CYP1A) enzymes play important roles in the metabolic activation and detoxification of numerous environmental carcinogens, including polycyclic aromatic hydrocarbons (PAHs). In this study, we tested the hypothesis that hepatic CYP1A2 differentially regulates mouse hepatic and pulmonary CYP1A1 expression and suppresses transcriptional activation of human CYP1A1 (hCYP1A1) promoter in response to 3-methylcholanthrene (MC) in vivo. Administration of wild-type (WT) (C57BL/6J) or Cyp1a2-null mice with a single dose of MC (100 μmol/kg i.p.) caused significant increases in hepatic CYP1A1/1A2 activities, apoprotein content, and mRNA levels 1 day after carcinogen withdrawal compared with vehicle-treated controls. The induction persisted in the WT, but not Cyp1a2-null, animals, for up to 15 days. In the lung, MC caused persistent CYP1A1 induction for up to 8 days in both genotypes, with Cyp1a2-null mice displaying a greater extent of CYP1A1 expression. It is noteworthy that MC caused significant augmentation of human CYP1A1 promoter activation in transgenic mice expressing the hCYP1A1 and the reporter luciferase gene on a Cyp1a2-null background, compared with transgenic mice on the WT background. In contrast, the mouse endogenous hepatic, but not pulmonary, persistent CYP1A1 expression was repressed by MC in the hCYP1A1-Cyp1a2-null mice. Liquid chromatography-mass spectrometry experiments showed that CYP1A2 catalyzed the formation of 1-hydroxy-3-MC and/or 2-hydroxy-3-MC, a metabolite that may contribute to the regulation of CYP1A1 expression. In conclusion, the results suggest that CYP1A2 plays a pivotal role in the regulation of hepatic and pulmonary CYP1A1 by PAHs, a phenomenon that potentially has important implications for PAH-mediated carcinogenesis.
Figures


Similar articles
-
Differential regulation of expression of hepatic and pulmonary cytochrome P4501A enzymes by 3-methylcholanthrene in mice lacking the CYP1A2 gene.J Pharmacol Exp Ther. 2002 Dec;303(3):945-51. doi: 10.1124/jpet.102.039982. J Pharmacol Exp Ther. 2002. PMID: 12438513
-
Persistent induction of cytochrome P450 (CYP)1A enzymes by 3-methylcholanthrene in vivo in mice is mediated by sustained transcriptional activation of the corresponding promoters.Biochem Biophys Res Commun. 2009 Dec 25;390(4):1419-24. doi: 10.1016/j.bbrc.2009.11.021. Epub 2009 Nov 11. Biochem Biophys Res Commun. 2009. PMID: 19900403 Free PMC article.
-
Cytochrome P4501A1 and 1A2 gene expression in the liver of 3-methylcholanthrene- and o-aminoazotoluene-treated mice: a comparison between PAH-responsive and PAH-nonresponsive strains.Toxicol Sci. 2003 May;73(1):108-13. doi: 10.1093/toxsci/kfg053. Epub 2003 Apr 15. Toxicol Sci. 2003. PMID: 12700417
-
Oral benzo[a]pyrene: understanding pharmacokinetics, detoxication, and consequences--Cyp1 knockout mouse lines as a paradigm.Mol Pharmacol. 2013 Sep;84(3):304-13. doi: 10.1124/mol.113.086637. Epub 2013 Jun 12. Mol Pharmacol. 2013. PMID: 23761301 Free PMC article. Review.
-
Knockout and humanized mice as suitable tools to identify enzymes metabolizing the human carcinogen aristolochic acid.Xenobiotica. 2014 Jan;44(2):135-45. doi: 10.3109/00498254.2013.848310. Epub 2013 Oct 23. Xenobiotica. 2014. PMID: 24152141 Review.
Cited by
-
Augmented oxygen-mediated transcriptional activation of cytochrome P450 (CYP)1A expression and increased susceptibilities to hyperoxic lung injury in transgenic mice carrying the human CYP1A1 or mouse 1A2 promoter in vivo.Biochem Biophys Res Commun. 2011 Apr 1;407(1):79-85. doi: 10.1016/j.bbrc.2011.02.113. Epub 2011 Mar 6. Biochem Biophys Res Commun. 2011. PMID: 21362406 Free PMC article.
-
Repurposing antifungal drugs for cancer therapy.J Adv Res. 2023 Jun;48:259-273. doi: 10.1016/j.jare.2022.08.018. Epub 2022 Sep 5. J Adv Res. 2023. PMID: 36067975 Free PMC article. Review.
-
Newborn Mice Lacking the Gene for Cyp1a1 Are More Susceptible to Oxygen-Mediated Lung Injury, and Are Rescued by Postnatal β-Naphthoflavone Administration: Implications for Bronchopulmonary Dysplasia in Premature Infants.Toxicol Sci. 2017 May 1;157(1):260-271. doi: 10.1093/toxsci/kfx036. Toxicol Sci. 2017. PMID: 28201809 Free PMC article.
-
The Multifarious Link between Cytochrome P450s and Cancer.Oxid Med Cell Longev. 2020 Jan 3;2020:3028387. doi: 10.1155/2020/3028387. eCollection 2020. Oxid Med Cell Longev. 2020. PMID: 31998435 Free PMC article. Review.
-
Polycyclic Aromatic Hydrocarbon-induced Pulmonary Carcinogenesis in Cytochrome P450 (CYP)1A1- and 1A2-Null Mice: Roles of CYP1A1 and CYP1A2.Toxicol Sci. 2020 Oct 1;177(2):347-361. doi: 10.1093/toxsci/kfaa107. Toxicol Sci. 2020. PMID: 32726451 Free PMC article.
References
-
- Bookout AL, Cummins CL, Mangelsdorf DJ, Pesola JM, Kramer MF. ( 2006) High-throughput real-time quantitative reverse transcription PCR. Curr Protoc Mol Biol Chapter 15, Unit 15.18 - PubMed
-
- Bradford MM. ( 1976) A rapid and sensitive method for the quantitation of microgram quantities of protein utilizing the principle of protein-dye binding. Anal Biochem 72: 248– 254 - PubMed
-
- Cinti DL, Moldeus P, Schenkman JB. ( 1972) Kinetic parameters of drug-metabolizing enzymes in Ca2+-sedimented microsomes from rat liver. Biochem Pharmacol 21: 3249– 3256 - PubMed
-
- Conney AH. ( 1986) Induction of microsomal cytochrome P-450 enzymes: the first Bernard B. Brodie lecture at Pennsylvania State University. Life Sci 39: 2493– 2518 - PubMed
Publication types
MeSH terms
Substances
Grants and funding
LinkOut - more resources
Full Text Sources
