. 2010 Nov;30(21):4980-95.
doi: 10.1128/MCB.00004-10. Epub 2010 Aug 23.

Doubles game: Src-Stat3 versus p53-PTEN in cellular migration and invasion

Affiliations

Doubles game: Src-Stat3 versus p53-PTEN in cellular migration and invasion

Utpal K Mukhopadhyay et al. Mol Cell Biol. 2010 Nov.

Abstract

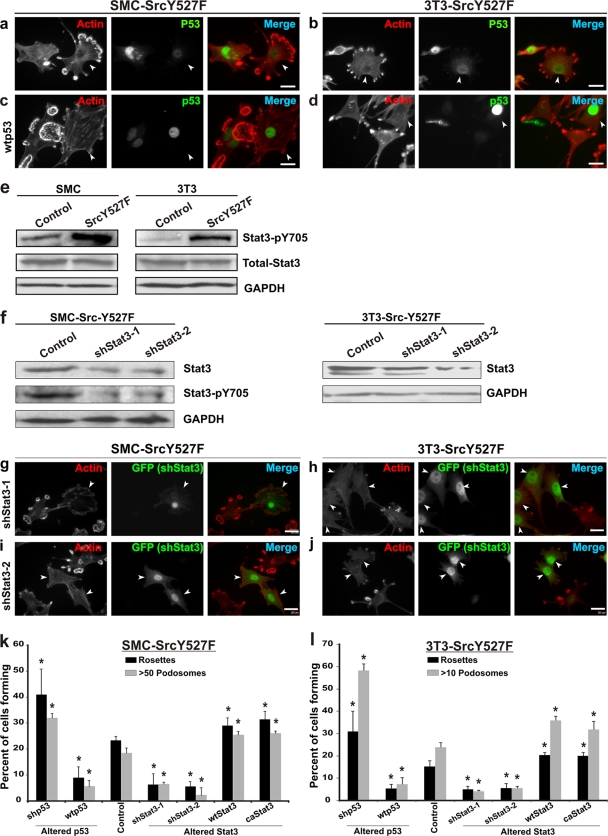
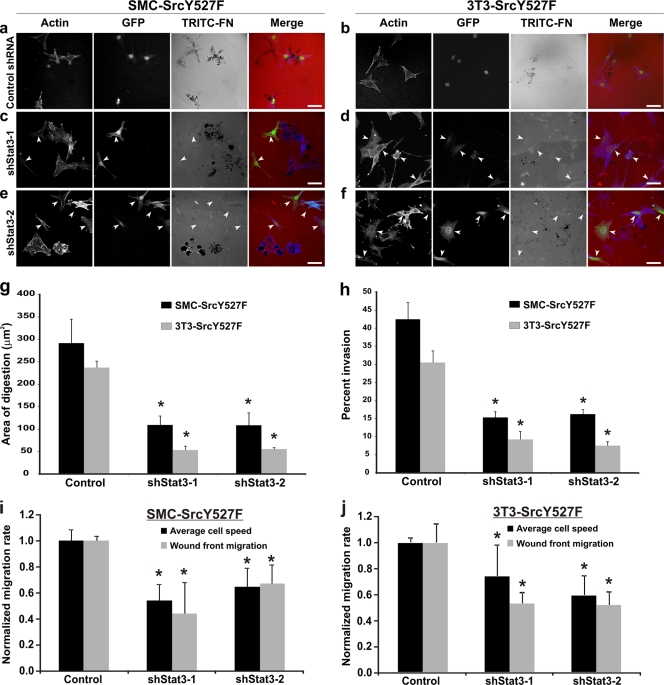
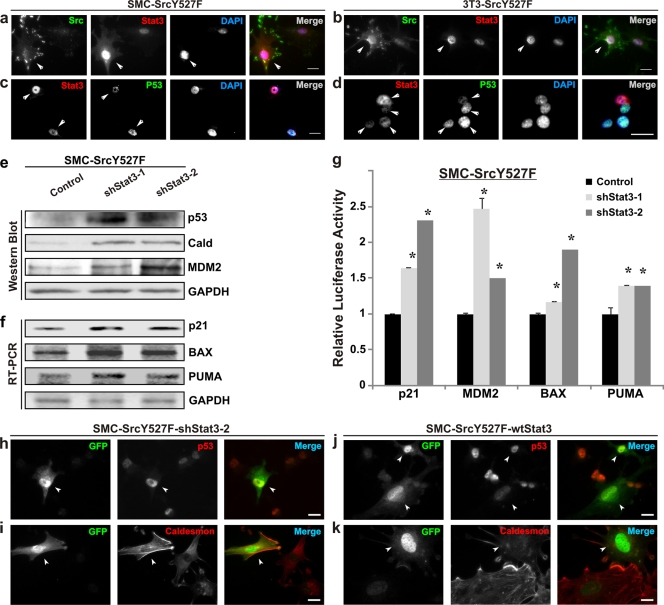
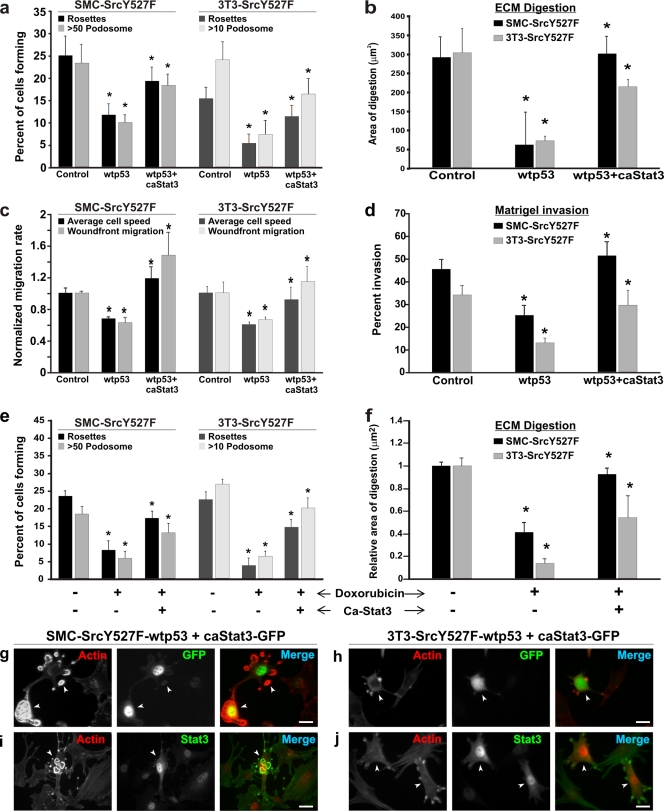
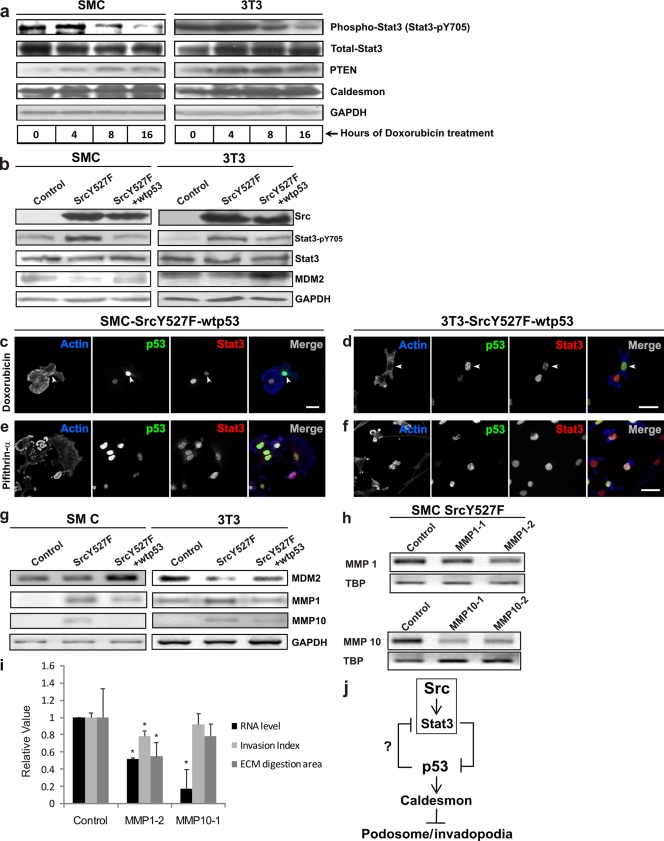
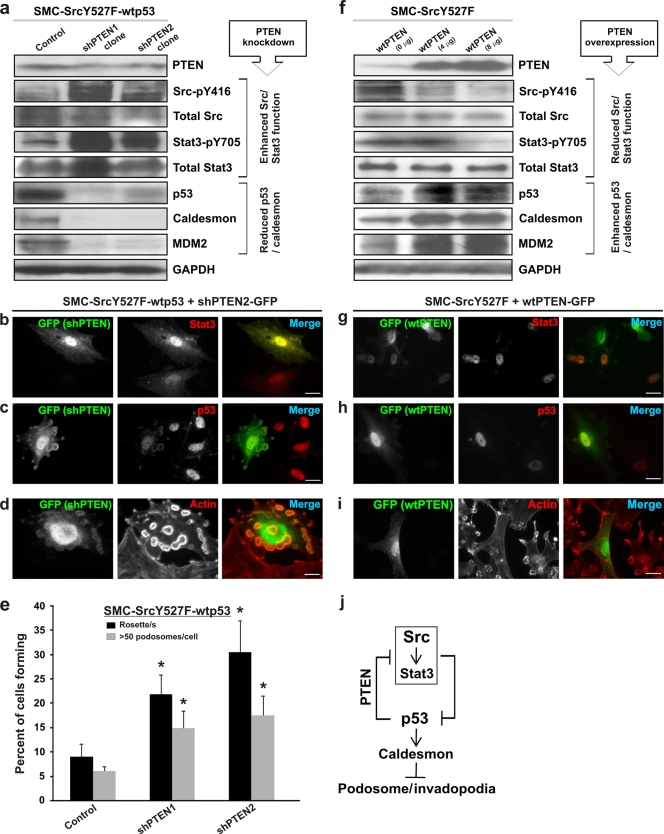
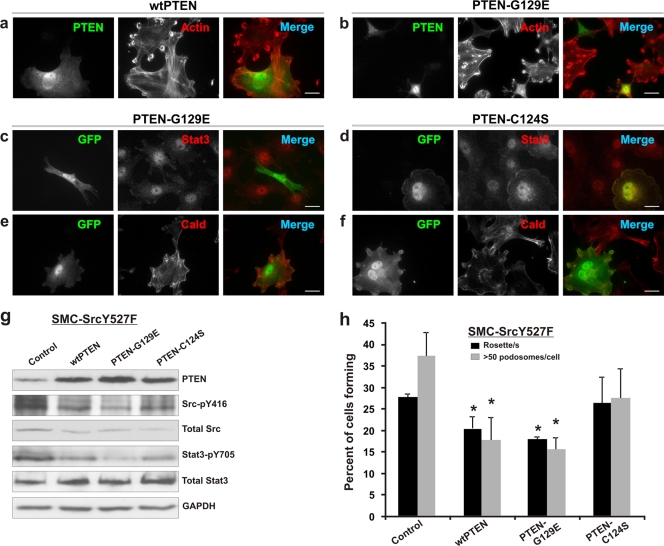
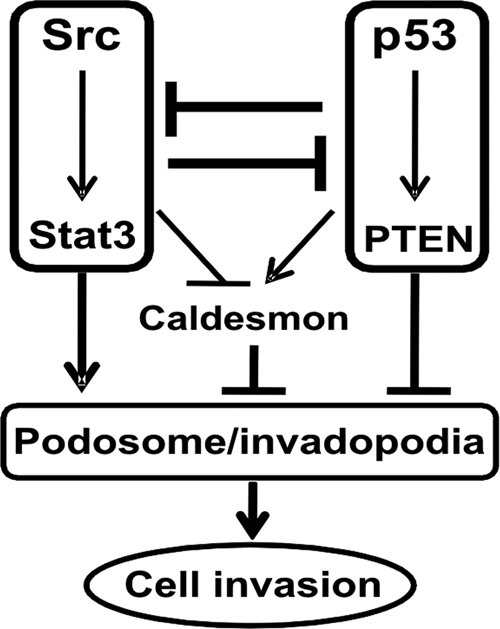
We have recently shown that Src induces the formation of podosomes and cell invasion by suppressing endogenous p53, while enhanced p53 strongly represses the Src-induced invasive phenotype. However, the mechanism by which Src and p53 play antagonistic roles in cell invasion is unknown. Here we show that the Stat3 oncogene is a required downstream effector of Src in inducing podosome structures and related invasive phenotypes. Stat3 promotes Src phenotypes through the suppression of p53 and the p53-inducible protein caldesmon, a known podosome antagonist. In contrast, enhanced p53 attenuates Stat3 function and Src-induced podosome formation by upregulating the tumor suppressor PTEN. PTEN, through the inactivation of Src/Stat3 function, also stabilizes the podosome-antagonizing p53/caldesmon axis, thereby further enhancing the anti-invasive potential of the cell. Furthermore, the protein phosphatase activity of PTEN plays a major role in the negative regulation of the Src/Stat3 pathway and represses podosome formation. Our data suggest that cellular invasiveness is dependent on the balance between two opposing forces: the proinvasive oncogenes Src-Stat3 and the anti-invasive tumor suppressors p53-PTEN.


Figures

FIG. 1.
FIG. 1.
p53 is a suppressor and Stat3 is a promoter of SrcY527F-induced formation of podosomes in SMC and 3T3 cells. (a and b) Immunofluorescence microscopic images of SMC and 3T3 cells stably expressing constitutively active SrcY527F. Cells forming large numbers of podosomes and rosettes as a result of SrcY527F expression (arrowheads) also show lower levels of nuclear p53. (c and d) SrcY527F cells transduced with a retroviral vector expressing wt p53. Cells with more-intense nuclear p53 staining (arrowheads) show a reduced capacity to form podosomes. TRITC-phalloidin was used to label actin-rich podosomes in panels a to d. (e) Western blots showing upregulation of active Stat3 (Stat3-pY705) in SMC (left) and 3T3 (right) cells stably expressing either an empty vector (control) or SrcY527F. (f) Western blot analysis of SrcY527F cells to show the knockdown of Stat3 and pYStat3 by shStat3-1 and shStat3-2. GAPDH was used as a loading control. (g to j) SrcY527F cells coexpressing shStat3-GFP were immunostained for GFP and F-actin using TRITC-phalloidin. shRNA-mediated knockdown of Stat3 (cells marked with arrowheads) as identified by GFP expression resulted in a diminished ability of SrcY527F cells to produce podosomes and rosettes. Bars, 20 mm. (k and l) Statistical analyses of the effects of either gain or loss of function for p53 and Stat3 on the ability of SrcY527F cells to form podosomes and rosettes. SMC (k) and 3T3 (l) cells coexpressing SrcY527F and either p53 or Stat3 constructs, as indicated, were used. A minimum of 100 individual cells in three separate experiments for each cell type, as labeled, were counted to determine the percentage of cells bearing high-density podosomes (>50 and >10 podosomes per cell, respectively, for SMC and 3T3 cell derivatives) or at least 1 rosette per cell. Error bars represent standard deviations for three separate experiments. P values were determined using a two-sided, equal-variance Student t test. *, significant difference (P < 0.05) in the count from that for the respective control.
FIG. 2.
FIG. 2.
Stat3 knockdown adversely affects ECM degradation, Matrigel invasion, and cell migration induced by SrcY527F in SMC and 3T3 cells. (a to f) SrcY527F cells stably transduced with either a control shRNA-GFP (a and b) or a Stat3-targeted shRNA-GFP (c to f) were used to study the effect of Stat3 knockdown on Src-induced ECM digestion. Cells were cultured on gelatin-coated coverslips layered with TRITC-fibronectin (TRITC-FN) for 7 h. Cells expressing shStat3 (marked with arrowheads) were monitored by GFP expression. Actin was labeled with phalloidin 350. Bars, 20 μm. (g) Quantitative measurements were performed to determine the area of ECM digestion for each cell type. Thirty cells for each category were measured for the area of digestion (in μm2) in the migration path of the cell after 7 h. (h) SMC- or 3T3-derived cell lines expressing the indicated constructs were examined in order to determine their ability to invade Matrigel. The number of cells that migrated through the screen was counted, and the percentage of invasion was determined by dividing the invasion number (Matrigel-coated screen) by the migrating number (uncoated screen). (i and j) A scratch-induced wound-healing assay was performed to determine the average migration rate of individual cells as well as the speed of wound front migration (wound closure) in SMC-SrcY527F (i) and 3T3-SrcY527F (j) cells expressing either an empty vector (control) or a shRNA against Stat3 (shStat3-1 or shStat3-2). Error bars represent standard deviations for three separate experiments. P values were determined using a two-sided, equal-variance Student t test. *, significant difference (P < 0.05) from the value for the respective control.
FIG. 3.
FIG. 3.
Src suppresses the podosome inhibitors p53/caldesmon through the activation of Stat3. (a to d) SMC and 3T3 cells stably transduced with SrcY527F were subjected to immunofluorescence microscopy. Cells were labeled with combinations of either Src and Stat3 (a and b) or Stat3 and p53 (c and d). DAPI was used as a nuclear stain. Arrowheads indicate cells expressing either higher Src/Stat3 levels (a and b) or contrasting levels of Stat3/p53 (c and d). (e to g) Stat3 knockdown results in upregulation of the level/function of p53/caldesmon. Proteins/mRNAs were isolated from SMC-SrcY527F cells stably infected either with an empty vector (control) or with shStat3 expression constructs (shStat3-1 and -2). The levels of the indicated proteins (e) and mRNAs (f) were analyzed by Western blotting and semiquantitative RT-PCR methods, respectively. GAPDH protein/mRNA levels were used as equal loading/amplification controls. (g) The relative promoter activities for the genes in the SMC-SrcY527F cell line were determined by a dual-luciferase assay. Error bars represent the standard deviations for three replicate measurements. Asterisks indicate significant differences (P < 0.05) from the respective controls. (h to k) Stat3 negatively regulates the podosome inhibitors p53 and caldesmon. SMC-SrcY527F cells were transiently transfected with either a shStat3-2 (coexpressing GFP) (h and i) or a wt Stat3 (cotransfected with GFP) (j and k) expression construct. The comparative expression patterns of p53 and caldesmon in transfected (GFP-positive) (indicated by arrowheads) and nontransfected (GFP-negative) cells were visualized by immunofluorescence microscopy. Bar, 20 μm.
FIG. 4.
FIG. 4.
caStat3 abrogates the suppressive effect of p53 on Src invasive phenotypes. (a to d) caStat3 rescues Src phenotypes from suppression by exogenously overexpressed p53. Stable cell lines expressing SrcY527F (control), SrcY527F-wt p53, or SrcY527F-wt p53-caStat3 were generated. (a) A minimum of 100 individual cells in three separate experiments for each cell type were counted in order to determine the percentage of cells bearing high-density podosomes (>50 and >10 podosomes per cell, respectively, for SMC and 3T3 cell derivatives) or at least 1 rosette per cell for both cell types. (b) Cells as indicated were cultured on gelatin-coated coverslips layered with TRITC-fibronectin for 7 h. Quantitative measurements were performed to determine the area of ECM digestion for each cell type. Thirty cells for each category were measured for the area of digestion (in μm2) in the migration path of the cell. (c and d) Stable SMC- or 3T3-derived cell lines as indicated were analyzed for their abilities to migrate (c) or invade (d) in vitro by wound-healing and Matrigel invasion assays, respectively. Asterisks in panels a to d indicate significant differences (P < 0.05) between control (SrcY527F) cells and SrcY527F-wt p53 cells or between SrcY527F-wt p53 and SrcY527F-wt p53-caStat3 cells. (e and f) SMC and 3T3 cells stably expressing SrcY527F (control) or SrcY527F-caStat3, as indicated, were treated with either dimethyl sulfoxide (−) or 500 ng/ml doxorubicin (+) in order to activate endogenous p53; then their abilities to form podosomes/rosettes and to digest ECM were assessed. In all cases, error bars represent standard deviations for three separate experiments. Asterisks indicate significant differences (P < 0.05) between control (SrcY527F) and SrcY527F-doxorubicin cells or between SrcY527F-doxorubicin and SrcY527F-doxorudicin-caStat3 cells. (g to j) Stable SrcY527F cells also expressing wt p53 (SrcY527F-wt p53) were transfected with a caStat3 expression construct (coexpressing GFP). These cells were immunostained for either GFP (g and h) or Stat3 (i and j) along with F-actin by using TRITC-phalloidin. Cells expressing caStat3, identifiable by either GFP or strong Stat3 staining (marked with arrowheads), regain the ability to produce large numbers of podosomes/rosettes. Bars, 20 μm.
FIG. 5.
FIG. 5.
Enhanced p53 deactivates the Src effector Stat3 with corresponding suppression of the Src phenotype. (a) Progressive activation of endogenous p53 leads to a corresponding decrease in active Stat3 (Stat3-pY705) levels. SMC and 3T3 cells were serum starved 24 h prior to treatment with the p53-activating drug doxorubicin (500 ng/ml) for different durations of time, as indicated. Cell lysates were immunoblotted for Stat3-pY705 and total Stat3. Levels of the p53-inducible proteins PTEN/caldesmon served as indicators of p53 activation. GAPDH levels served as a loading control. (b) Regulation of Stat3 activation by Src and p53. The Stat3-pY705 status as a result of expression of either SrcY527F or SrcY527F-wt p53 was determined by a Western blot assay. The level of MDM2 protein was used to monitor cellular p53 function, while the GAPDH protein level served as a loading control. (c to f) Effects of p53 function on expression levels of nuclear p53/Stat3 and the formation of actin-rich podosomes in SrcY527F-wt p53 cells. p53 activation with doxorubicin (c and d) results in strong nuclear p53 staining (arrowheads), with concomitant reduction of functional, nuclear Stat3 staining. Inhibition of p53 with pifithrin-α (e and f) causes an increase in the level of Stat3 nuclear staining but a decrease in nuclear p53. Bars, 20 μm. (g) Semiquantitative RT-PCR assay to show that wt p53 suppresses the expression of Stat3-regulated MMP1 and MMP10 in SrcY527F cells. Cellular p53 function was reflected by MDM2 mRNA levels. GAPDH mRNA served as an internal control. (h) Knockdown of MMP1 and MMP10 expression by siRNAs. TBP was used an as internal control. (i) Effects of MMP1 and MMP10 knockdown on ECM digestion and Matrigel invasion. Error bars represent standard deviations for three independent experiments. Asterisks indicate significant differences (P < 0.05). (j) Schematic representation of the process by which Src leads to the formation of podosome/invadopodial structures and the role of Stat3-p53 antagonism, downstream of Src, in modulating the Src-invasive phenotype. Src suppresses p53 through Stat3-mediated transcriptional repression. p53, on the other hand, deactivates Stat3, likely through a p53-inducible tyrosine phosphatase such as PTEN.
FIG. 6.
FIG. 6.
PTEN is a mediator of p53-induced suppression of Src phenotypes. (a to e) Effect of PTEN knockdown on the Src/Stat3/p53/caldesmon/podosome expression status in SMC-SrcY527F-wt p53 cells. (a) SMC-SrcY527F-wt p53 cells retrovirally transduced with anti-PTEN shRNAs. One clone each for shPTEN-1 and shPTEN-2 was analyzed by Western blotting. GAPDH was used as a loading control. (b to d) A stable SMC-SrcY527F-wt p53 cell line was transfected with one of the shPTEN expression constructs (coexpressing GFP) and was analyzed by immunofluorescence microscopy as indicated. TRITC-phalloidin was used for actin/podosome staining. Bars, 20 μm. (e) A stable SMC-SrcY527F-wt p53 cell line was transfected with either an empty vector (control) or one of two shPTEN expression constructs (shPTEN-1 and shPTEN-2) and was then assayed for podosome/rosette formation. Error bars represent standard deviations for three independent measurements. Asterisks indicate significant differences (P < 0.05) from the control. (f to i) Effect of PTEN overexpression on the Src/Stat3/p53/caldesmon/podosome expression status in SMC-SrcY527F cells. (f) SMC-SrcY527F cells were transiently transfected with increasing amounts of a wt PTEN expression construct (0, 4, and 8 μg DNA per 10-cm-diameter plate at about 80% confluence) using the Lipofectamine Plus protocol. Forty-eight hours posttransfection, samples were analyzed by Western blotting for proteins/phosphoproteins as shown. GAPDH protein levels indicate equal loading. (g to i) SMC-SrcY527F cells were cotransfected with wt PTEN and a GFP expression construct (pBabe-GFP) prior to analysis by fluorescence imaging. TRITC-phalloidin was used for actin/podosome staining. Bars, 20 μm. (j) PTEN mediates the suppressive effect of p53 on invasive phenotypes by inactivating Src/Stat3, which also serves to stabilize the podosome-antagonizing p53-caldesmon axis.
FIG. 7.
FIG. 7.
Role of the lipid phosphatase/protein phosphatase activity of PTEN in the regulation of Src/Stat3 function and podosome formation. (a to f) SMC-SrcY527F cells were transiently transfected with various PTEN expression constructs either alone (a and b) or in combination with a GFP expression vector (pBabe-GFP) (c to f). Cells overexpressing either wt PTEN (a) or PTEN-G129E (b) form fewer podosomes than nontransfected cells. Fluorescent microscopic images show the effect of overexpressed PTEN-G129E (c and e) or PTEN-C124S (d and f) on Stat3 and caldesmon (Cald) expression. Bars, 20 μm. (g) SMC-SrcY527F cells were transiently transfected with either an empty vector (control) or various PTEN expression constructs (8 μg DNA per 10-cm-diameter plate) using the Lipofectamine Plus protocol. The cell lysates were prepared 48 h posttransfection and were Western blotted for proteins/phosphoproteins as shown. GAPDH protein levels were used as a loading control. (h) SMC-SrcY527F cells were transfected with pBabe-GFP either alone (control) or along with wild-type/mutant PTEN expression constructs as indicated and were assayed for podosome/rosette formation. Error bars represent standard deviations of three independent measurements. Asterisks indicate significant differences (P < 0.05) from control values.
FIG. 8.
FIG. 8.
Schematic representation of the mutual antagonism of the Src-Stat3 and p53-PTEN axes in the regulation of cellular invasion. Two opposing forces, constituted by the proinvasive oncogenes Src-Stat3 and the anti-invasive tumor suppressors p53-PTEN, antagonize each other, affecting cellular invasive phenotypes. The dominant force likely determines the level of caldesmon expression and thereby the formation of invasive podosomes/invadopodia.

Similar articles

Cited by

References

    1. Abdulghani, J., L. Gu, A. Dagvadorj, J. Lutz, B. Leiby, G. Bonuccelli, M. P. Lisanti, T. Zellweger, K. Alanen, T. Mirtti, T. Visakorpi, L. Bubendorf, and M. T. Nevalainen. 2008. Stat3 promotes metastatic progression of prostate cancer. Am. J. Pathol. 172:1717-1728. - PMC - PubMed
    1. Artym, V. V., Y. Zhang, F. Seillier-Moiseiwitsch, K. M. Yamada, and S. C. Mueller. 2006. Dynamic interactions of cortactin and membrane type 1 matrix metalloproteinase at invadopodia: defining the stages of invadopodia formation and function. Cancer Res. 66:3034-3043. - PubMed
    1. Aylon, Y., and M. Oren. 2007. Living with p53, dying of p53. Cell 130:597-600. - PubMed
    1. Bowman, T., M. A. Broome, D. Sinibaldi, W. Wharton, W. J. Pledger, J. M. Sedivy, R. Irby, T. Yeatman, S. A. Courtneidge, and R. Jove. 2001. Stat3-mediated Myc expression is required for Src transformation and PDGF-induced mitogenesis. Proc. Natl. Acad. Sci. U. S. A. 98:7319-7324. - PMC - PubMed
    1. Brisbin, S., J. Liu, J. Boudreau, J. Peng, M. Evangelista, and I. Chin-Sang. 2009. A role for C. elegans Eph RTK signaling in PTEN regulation. Dev. Cell 17:459-469. - PubMed

Publication types

MeSH terms