. 2010 Aug 30;207(9):1923-38.
doi: 10.1084/jem.20100040. Epub 2010 Aug 23.

Rap1b facilitates NK cell functions via IQGAP1-mediated signalosomes

Affiliations

Rap1b facilitates NK cell functions via IQGAP1-mediated signalosomes

Aradhana Awasthi et al. J Exp Med. .

Abstract

Rap1 GTPases control immune synapse formation and signaling in lymphocytes. However, the precise molecular mechanism by which Rap1 regulates natural killer (NK) cell activation is not known. Using Rap1a or Rap1b knockout mice, we identify Rap1b as the major isoform in NK cells. Its absence significantly impaired LFA1 polarization, spreading, and microtubule organizing center (MTOC) formation in NK cells. Neither Rap1 isoform was essential for NK cytotoxicity. However, absence of Rap1b impaired NKG2D, Ly49D, and NCR1-mediated cytokine and chemokine production. Upon activation, Rap1b colocalized with the scaffolding protein IQGAP1. This interaction facilitated sequential phosphorylation of B-Raf, C-Raf, and ERK1/2 and helped IQGAP1 to form a large signalosome in the perinuclear region. These results reveal a previously unrecognized role for Rap1b in NK cell signaling and effector functions.


Figures

Figure 1.
Figure 1.
Rap1b is the major isoform, and its absence affects LFA1 polarization and NK cell spreading. (A) Expression levels of total Rap1, Rap1a, or Rap1b were analyzed in IL-2–cultured splenic NK cells from the indicated mice. (B) Western blot of recombinant GST-Rap1a (full-length Rap1a) and GST-Rap1b (85-184aa Rap1b) with anti-total Rap1, anti-Rap1a, anti-Rap1b, and anti-GST antibodies. (C and D) IL-2–cultured splenic NK cells were activated with PMA and ionomycin and stained for F-actin (green) and LFA1 (red). Images representative of individual or merged confocal images are shown (C). A total of 225 (Rap1a+/+), 219 (Rap1a−/−), 184 (Rap1b+/+), and 199 (Rap1b−/−) NK cells were analyzed. Localization of LFA1 in a focal point that is less than one fourth of the cell’s total diameter was taken as successful polarization. Arrowheads mark the polarized LFA1. Percentages of polarized cells are shown in D. (E and F) ELISA plates were coated with isotype control (IgG), anti-LFA1 (M17/4), anti-NKG2D (A10; each 5 µg/ml), or recombinant ICAM1-Fc (5 µg/ml) and used to stimulate NK cells. Phase-contrast images were obtained after 3 h of incubation, and the spread cells were defined as the ones that lacked clearly visible edges (E). Bar graphs represent the percentages of spread NK cells. The following numbers of NK cells were analyzed for isotype control, anti-NKG2D, ICAM1-Fc, and anti-LFA1, respectively for indicated genotypes: Rap1a+/+, 464, 356, 396, and 260; Rap1a−/−, 404, 299, 372, and 286; Rap1b+/+, 417, 260, 319, and 265; and Rap1b−/−, 403, 487, 411, and 517. (F). Results presented in A-F were representatives of a minimum of three independent experiments.
Figure 2.
Figure 2.
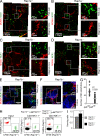
In vivo trafficking and homing of NK cells. (A–D) Spleen cryosections (7 µm thick) from Rap1a+/+ (A), Rap1a−/− (B), Rap1b+/+ (C), and Rap1b−/− (D) mice were stained with anti-MOMA (red) or anti-NCR1 (green) and analyzed in immunofluorescence microscope. Data shown are 12 individual 20× images assembled into a single panel for each genotype. White boxes indicate a select area that is enlarged to show details. Top enlarged images for each genotype represents NK cells (green) in the red pulp area. Bottom enlarged images show organization of metallophilic macrophages (red) around each follicle. A minimum of 40 white pulp areas were analyzed for each genotype. Images represent data analyzed from seven mice for each genotype. Bars: (assembled) 110 µm; (enlarged) 11 µm. Data shown are one representative set out of. (E–G) Spleens from Rap1b+/+ (E) or Rap1b−/− (F) mice treated intraperitoneally with Con A were stained with anti-MOMA (red), anti-B220 (blue), and anti-NCR1 (green) and analyzed through confocal microscope. White boxes represent enlarged views. Top enlarged images represent NCR1+ NK cells (green) within the red pulp area. Bottom enlarged images represent NCR1+ NK cells (green) that have trafficked into the follicular region. (G) Total numbers of NCR1+ NK cells that have trafficked inside individual follicles (●-Rap1b+/+, ●-Rap1b−/−) and their averages (–) are shown. 20 individual follicles were analyzed for Rap1b+/+ and Rap1b−/− mice. (H and I) RBC-depleted Rap1b+/+ and Rap1b−/− splenocytes were labeled with CFSE and TAMRA, respectively and injected into Rap1b+/+ recipient mice. 3 h later, cells from spleens of recipient mice were stained with anti-NK1.1-APC and anti-CD3-PE-Cy7. CD3NK1.1+ cells were gated and shown (H). (I) Bar graph represents the average ratio between the recovered Rap1b+/+ and Rap1b−/− NK cells, after correction to the ratio of input cells. Data shown in H and I were obtained from four recipient mice. Data shown in A–I are one representative of three independent experiments.
Figure 3.
Figure 3.
Stimulation via NKG2D activates Rap1 and lack of Rap1 does not affect NK cytotoxicity. (A) IL-2–cultured NK cells were activated with anti-NKG2D (A10; 5 µg/ml). Rap1-GTP was detected with anti-Rap1 or anti-Rap1b after pull-down. Total Rap1 or Rap1b proteins were quantified by analyzing the unfractionated NK cell lysates. A nonhydrolysable analogue of GTP, γGTPS, was also used to measure the total Rap1 and Rap1b. (B) NK cells (CFSE-labeled) and YAC-1 cells (TAMRA-labeled) were mixed at 1:1 ratio, and the double-positive conjugate percentages were quantified after fixing. (C) IL-2–activated splenic NK cells were incubated with [51Cr]-labeled target cells at the indicated E:T ratios for 4 h. Three to five mice were used for each genotype. (D) RMA cells (TAMRA-labeled) and RMA/S cells (CFSE-labeled) were injected into mice and recovered peritoneal exudate cells were analyzed by flow cytometry. Clearance of RMA/S versus RMA cells was calculated compared with the input ratio, which was normalized to 1. RMA cells, which are not cleared by Rap1b+/+ or Rap1b−/− mice acted as an internal control. Results presented in A–D are representative of three independent experiments.
Figure 4.
Figure 4.
Lack of Rap1b results in reduced generation of cytokines and chemokines. (A) IL-2–cultured splenic NK cells (105 cells/well) were activated with anti-NKG2D (A10) and the supernatants were tested for cytokines or chemokines by ELISA and multiplex assays. Data presented are the mean with standard deviations from a minimum of 10 mice for each genotype from >3 independent experiments. (B) IL-2–cultured splenic NK cells were stimulated with anti-NKG2D (A10; 5 µg/ml). Activated CD3NK1.1+ NK cells stained for intracellular IFN-γ (blue), F-actin (red), and Rap1 (green) and analyzed through confocal microscopy. Arrowheads mark IFN-γ. Data presented are representative images of >30 individual cells from 3 independent experiments. (C and D) NK cells were stimulated with anti-Ly49D (4E5; D) or anti-NK1.1 (PK136; D) and IFN-γ production was measured. (E) IFN-γ–encoding transcripts were quantified in splenic NK cells after anti-NKG2D stimulation. (F) IL-2–cultured NK cells were activated with IL-12, IL-18, or both (10 µg/ml) for 24 h and the supernatants were tested for the quantity of IFN-γ. (G) Splenic NK cells were co-cultured with LA4 cells with or without PR8 influenza, and IFN-γ was measured by multiplex assays after 16 h. Data presented in C–G were averages with standard deviations of three independent experiments.
Figure 5.
Figure 5.
Rap1b regulates IQGAP1-mediated signaling cascade. (A) IL-2–cultured splenic NK cells were activated with anti-NKG2D for 30 min and stained for total Rap1 (green), IQGAP1 (red), and DAPI (blue) and analyzed by confocal microscopy. Inserts in the bottom panels are the enlarged views of the select NK cells. (B and C) NK cells from Rap1b+/+ or Rap1b−/− mice were stimulated with anti-NKG2D for the indicated periods and the phosphorylation of Vav-1 (B) and Pak-1/2/3 (C) was analyzed. (D) IL-2–cultured splenic NK cells from Rap1b+/+ mice were stimulated with anti-NKG2D (A10; 5 µg/ml). Cell lysates were subjected to immunoprecipitation (IP) with anti–B-Raf or pull down (PD) using recombinant GST-C-Raf. Resulting IP or PD were probed for the presence of Rap1-GTP or Rap1b-GTP. One representative experiment out of three is shown. (E and F) IL-2–cultured NK cells were stimulated with anti-NKG2D, and the cell lysates were analyzed for phospho and total proteins of B-Raf and C-Raf (E) or p38, JNK1/2, and ERK1/2 (F). Data presented in A–F were one representative of three independent experiments.
Figure 6.
Figure 6.
Rap1b regulates IQGAP1-mediated signalosome formation and ERK1/2 phosphorylation. (A) anti-NKG2D or (B) unstimulated splenic NK cells were stained for phospho ERK1/2 (green), IQGAP1 (red), and DAPI (blue), and analyzed by confocal microscopy. Data presented were one representative set from of >3 independent experiments.
Figure 7.
Figure 7.
IQGAP1 mediates the formation of a large signalosome in the perinuclear region of the activated NK cells. IL-2–cultured splenic Rap1b+/+ (A) and Rap1b−/− (B) NK cells were activated with anti-NKG2D (A10) for 30 min and stained for IQGAP1 (red), phospho-ERK1/2 (green), and DAPI (blue). Three dimensional reconstruction of images was done using 40 individual Z-stacks that were 0.4 µm thick, using FV1-ASW2.0 software. Data shown are one representative panel of 20 images analyzed from three independent experiments.
Figure 8.
Figure 8.
Rap1b colocalizes with MTOC and regulates its proper formation in NK cells. (A) NK cells from indicated mice were stimulated with anti-NKG2D (A10; 5 µg/ml) for 2 h and stained for α-tubulin (red) and F-actin (green). Data presented are one representative confocal image of 50 cells analyzed for each genotype. Precise sizes of MTOCs were measured by drawing a reference line across the longitudinal length of each NK cell. (B) Lengths of the MTOCs of NK cells from Rap1a+/+ (n = 22), Rap1a−/− (n = 60), Rap1b+/+ (n = 39), and Rap1b−/− (n = 67) were compared with their respective total cell length and presented as the percent of total cell length. (C) NK cells were stained for α-tubulin (red) and total Rap1 (green). Confocal images of NK cells at different z-planes with 0.4-µm intervals are shown. Arrowheads mark the colocalized Rap1 and MTOC. Data presented are representative images of >50 microscopic fields analyzed for each genotype from >3 independent experiments.

Similar articles

Cited by

References

    1. Arthur W.T., Quilliam L.A., Cooper J.A. 2004. Rap1 promotes cell spreading by localizing Rac guanine nucleotide exchange factors. J. Cell Biol. 167:111–122 10.1083/jcb.200404068 - DOI - PMC - PubMed
    1. Awasthi A., Samarakoon A., Dai X., Wen R., Wang D., Malarkannan S. 2008. Deletion of PI3K-p85alpha gene impairs lineage commitment, terminal maturation, cytokine generation and cytotoxicity of NK cells. Genes Immun. 9:522–535 10.1038/gene.2008.45 - DOI - PMC - PubMed
    1. Barber D.F., Faure M., Long E.O. 2004. LFA-1 contributes an early signal for NK cell cytotoxicity. J. Immunol. 173:3653–3659 - PubMed
    1. Basto R., Brunk K., Vinadogrova T., Peel N., Franz A., Khodjakov A., Raff J.W. 2008. Centrosome amplification can initiate tumorigenesis in flies. Cell. 133:1032–1042 10.1016/j.cell.2008.05.039 - DOI - PMC - PubMed
    1. Berenson L.S., Yang J., Sleckman B.P., Murphy T.L., Murphy K.M. 2006. Selective requirement of p38alpha MAPK in cytokine-dependent, but not antigen receptor-dependent, Th1 responses. J. Immunol. 176:4616–4621 - PubMed

Publication types

MeSH terms

Substances