

Review
doi: 10.1083/jcb.201004052.
Mass spectrometry-based proteomics in cell biology
Affiliations
- PMID: 20733050
- PMCID: PMC2928005
- DOI: 10.1083/jcb.201004052
Item in Clipboard
Review
Mass spectrometry-based proteomics in cell biology
J Cell Biol.
.
Abstract
The global analysis of protein composition, modifications, and dynamics are important goals in cell biology. Mass spectrometry (MS)-based proteomics has matured into an attractive technology for this purpose. Particularly, high resolution MS methods have been extremely successful for quantitative analysis of cellular and organellar proteomes. Rapid advances in all areas of the proteomic workflow, including sample preparation, MS, and computational analysis, should make the technology more easily available to a broad community and turn it into a staple methodology for cell biologists.
Figures

A prototypical proteomics pipeline. Different samples are processed and fed into the proteomics pipeline, yielding different results depending on the application. The pipeline consists of several steps, listed in the different panels: proteolytic digest (1), the separation and ionization of peptides by liquid chromatography (LC) coupled to electrospray ionization (2), their analysis by MS (3), fragmentation of selected peptides and analysis of the resulting MS/MS spectra (4) and data analysis, including identification and quantification of proteins from several detected peptides, as well as downstream bioinformatic analysis depending on the specific application (5). The peptide peaks in panel 3 represent isotopically labeled variants of the same peptide, in this case using the SILAC methodology. Their intensity ratio is used for relative quantitation of proteins present in two samples. In the workflow described here, mass spectrometry is performed with a linear ion trap–Orbitrap instrument (LTQ-Orbitrap) and computational proteomics is done within the MaxQuant framework. LC-MS/MS, liquid chromatography coupled online to mass spectrometry; MS, mass spectrometry; MS/MS, tandem mass spectrometry; PTM, post-translational protein modification; Protein ID, protein identification; m/z, mass- to-charge ratio.

Organellar proteomics. Organelles are purified using fractionation of a cell extract, e.g., by gradient centrifugation. The resulting gradient (gray box) is divided into samples and these resulting fractions are analyzed using the proteomics pipeline. Comparison of the abundance profiles of proteins (bottom panel, green lines) throughout all fractions of the purification to the profile of known marker protein (bottom panel, red line) yields classes of proteins that cofractionate with the organelle of interest (protein abundance marked with crosses), or that are present in the peak fraction for this organelle merely as a contaminant (protein abundance marked with circles or triangles).

Interaction proteomics. To detect specific binders to a tagged protein of interest (e.g., GFP, green sphere on target protein), abundance of potential interaction partners is compared with the abundance of the same protein from a mock purification expressing only untagged versions of the proteins. For example, extracts from “heavy” SILAC-labeled cells expressing tagged proteins (left) or control extracts (right) are subjected to affinity chromatography. The resulting eluates from target and mock purification are mixed and analyzed by the proteomics pipeline. Background binders are present in equal amounts in both purifications (circles in the plot), whereas proteins specifically binding to the bait have high ratios reflecting their specific enrichment from the heavy SILAC-labeled sample (rectangles in the plot).
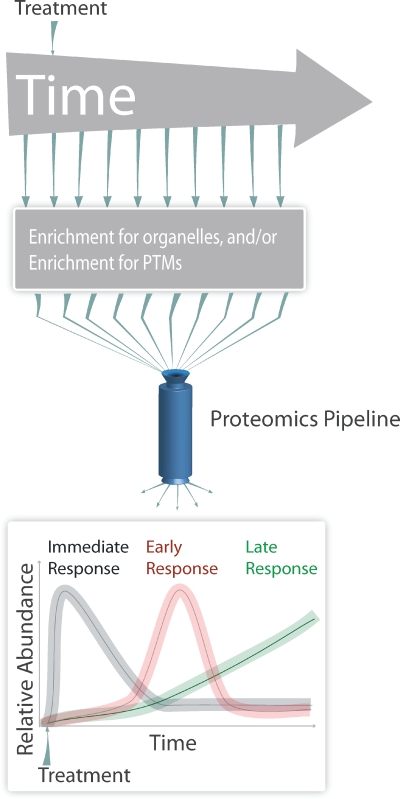
Time-resolved proteomics. To detect dynamic proteome changes after a change of conditions, the amount of proteins is followed over time after an initial treatment. For example, cells are treated with a stimulus at the beginning of the experiment and aliquots are analyzed in intervals either directly or after enrichment of organelles, protein complexes, or posttranslational modifications (PTMs) by the proteomics pipeline. Plotting the abundance of proteins or modifications over time results in a dynamic view of the abundance of proteins or specific modifications during the time course of the experiment, and may identify different phases of the response (e.g., immediate, early, and late response).
References
Publication types
MeSH terms
Substances
LinkOut - more resources
Full Text Sources
Other Literature Sources
