. 2010 Aug 23;190(4):501-9.
doi: 10.1083/jcb.201001083.

How cyclin A destruction escapes the spindle assembly checkpoint

Affiliations

How cyclin A destruction escapes the spindle assembly checkpoint

Barbara Di Fiore et al. J Cell Biol. .

Abstract

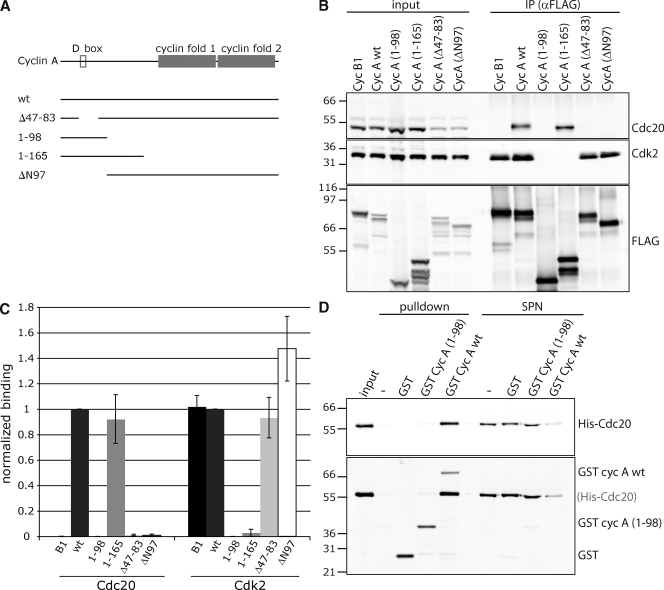
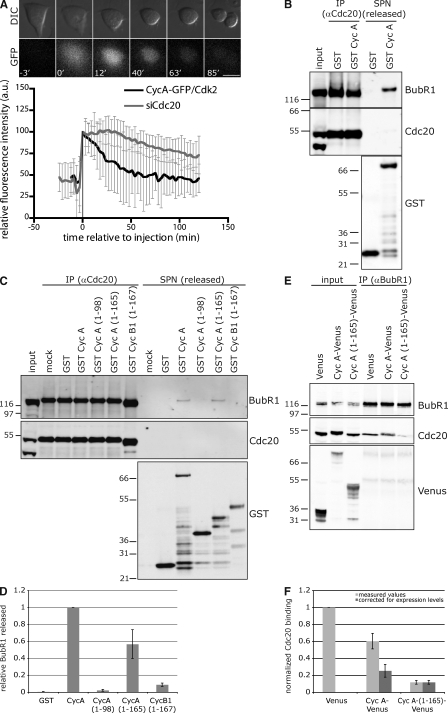
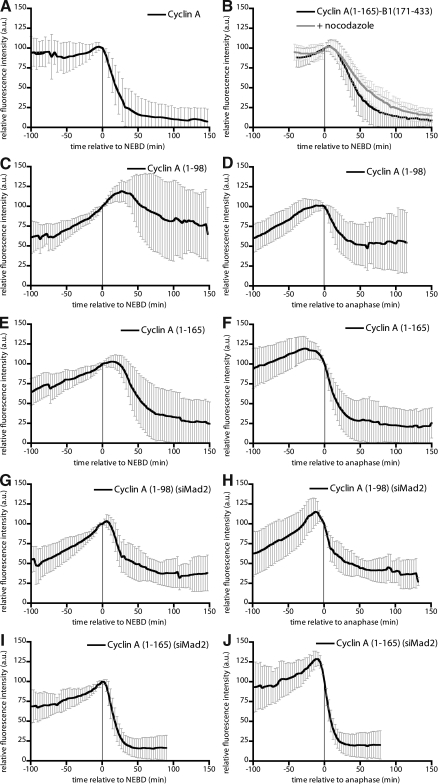
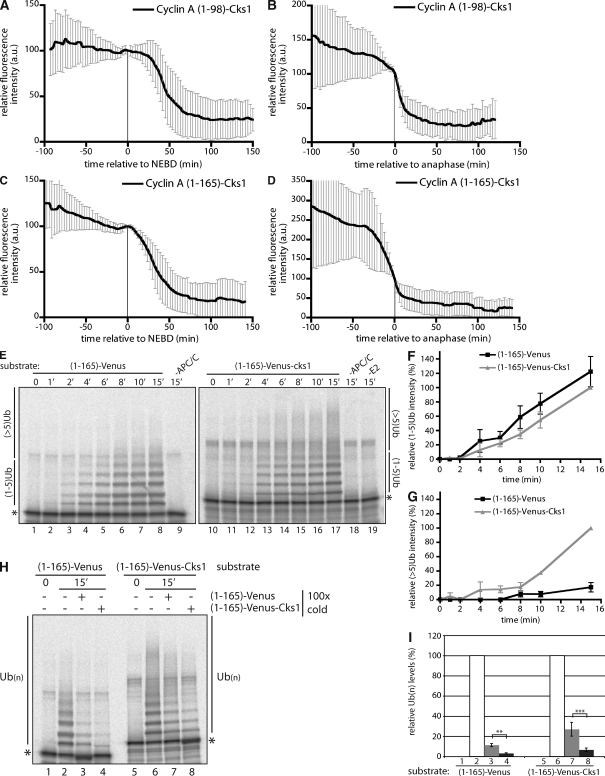
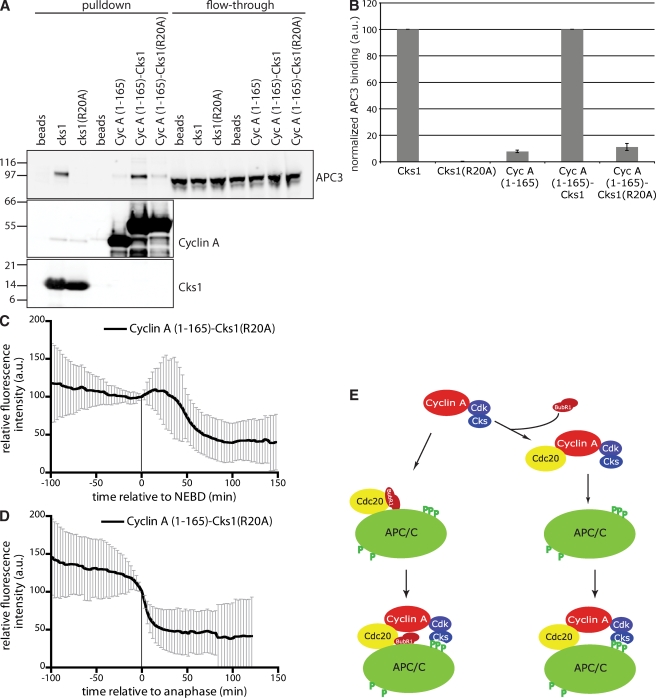
The anaphase-promoting complex/cyclosome (APC/C) is the ubiquitin ligase essential to mitosis, which ensures that specific proteins are degraded at specific times to control the order of mitotic events. The APC/C coactivator, Cdc20, is targeted by the spindle assembly checkpoint (SAC) to restrict APC/C activity until metaphase, yet early substrates, such as cyclin A, are degraded in the presence of the active checkpoint. Cdc20 and the cyclin-dependent kinase cofactor, Cks, are required for cyclin A destruction, but how they enable checkpoint-resistant destruction has not been elucidated. In this study, we answer this problem: we show that the N terminus of cyclin A binds directly to Cdc20 and with sufficient affinity that it can outcompete the SAC proteins. Subsequently, the Cks protein is necessary and sufficient to promote cyclin A degradation in the presence of an active checkpoint by binding cyclin A-Cdc20 to the APC/C.


Figures

Figure 1.
Figure 1.
The N terminus of cyclin A binds Cdc20. (A) Schematic representation of cyclin A mutants. (B) Stable inducible HeLa FRT cell lines expressing cyclin B1, and the cyclin A mutants were synchronized in mitosis by a single thymidine block and released in the presence of nocodazole. To prevent cyclin A degradation, MG132 was added 2 h before collecting mitotic cells by shake off. Cells were lysed, and anti-Flag immunoprecipitates (IP) were probed for Cdc20, Cdk2, and Flag. (C) Cdc20 and Cdk2 levels in the anti-Flag immunoprecipitates (B) were quantified using an Odyssey scanner, corrected for the level of Flag-tagged protein, and normalized to the amount bound to wt cyclin A. Error bars indicate mean ± SEM from three experiments. (D) GST–cyclin A was purified from bacteria and incubated for 2 h at 4°C with His6-Cdc20 purified from insect cells. Cyclin A was isolated on glutathione beads, and the beads and supernatants (SPN) analyzed by immunoblots were probed for Cdc20 and GST. Values are representative of seven experiments. Molecular mass markers are shown on the left (kilodaltons).
Figure 2.
Figure 2.
Cyclin A competes with BubR1 for binding to Cdc20. (A) The cyclin A–GFP–Cdk2 complex was purified from baculovirus-infected insect cells and injected into prometaphase HeLa cells identified by DIC (top). Time is relative to time of injection (min). Bar, 10 µm. GFP fluorescence through mitosis was measured (bottom) for normal (black curve) and Cdc20-depleted (gray curve) cells and set to 100 at the time of injection. Error bars indicate mean ± SD of 22 cells from two experiments (control) and 26 cells from two experiments (siCdc20). (B) Cdc20 bound in the SAC complex was immunoprecipitated (IP) with anti-Cdc20 antibodies from nocodazole-arrested cells and incubated with GST alone or GST–cyclin A for 2 h at 4°C. The supernatant (SPN) was removed and analyzed by immunoblotting for BubR1, Cdc20, and GST. Black line indicates that intervening lanes have been spliced out. (C) Cdc20 immunoprecipitates (obtained as in B) were incubated with buffer (mock), GST, the indicated GST–cyclin A mutants, or GST–cyclin B1 (1–167) and analyzed as in B. (D) The amount of BubR1 released from the immunocomplex (C) was quantified using an Odyssey scanner, corrected for the amount of Cdc20 immunoprecipitated and normalized to that released by wt cyclin A. Error bars indicate mean ± SEM from at least five experiments. (E) Stable cell lines expressing either Venus alone, cyclin A–Venus, or cyclin A (1–165)–Venus were treated with nocodazole, and MG132 was added 2 h before lysis. Anti-BubR1 immunoprecipitates were probed for BubR1, Cdc20, and Venus. (F) The amount of Cdc20 associated with immunoprecipitated BubR1 (E) was quantified as in D and corrected for the amount of immunoprecipitated BubR1 (light gray). To compare the wt and 1–165 samples, the values were corrected for expression levels, setting the 1–165-Venus level to 1 (dark gray). Error bars indicate mean ± SEM from four experiments. (B, C, and E) Input represents 1/10 of the immunoprecipitation. Molecular mass markers are shown on the left (kilodaltons).
Figure 3.
Figure 3.
Binding to Cdc20 only confers SAC-dependent destruction. (A) HeLa cells were injected in G2 phase with cyclin A–Venus-Flag, and the fluorescence was measured through mitosis. Fluorescence at NEBD is set to 100. Error bars indicate mean ± SD of 36 cells. Time is relative to NEBD. (B) Mean degradation curve of a chimera between the N terminus of cyclin A (1–165) and C terminus of cyclin B1 (171–433) obtained as in A in the absence (black curve) or presence (gray curve) of nocodazole. Error bars indicate mean ± SD of 49 cells from three experiments (untreated) and 27 cells from two experiments (nocodazole). (C–F) Mean degradation curve of cyclin A (1–98)–Venus-Flag (C and D) and cyclin A (1–165)–Venus-Flag (E and F) obtained as in A. Time is relative to NEBD (C and E) or anaphase (D and F), and fluorescence at NEBD or anaphase is set to 100. Error bars indicate mean ± SD of 12 cells from three experiments (C and D) and 36 cells from three experiments (E and F). (G–J) Mean degradation curve of cyclin A (1–98)–Venus-Flag (G and H) and cyclin A (1–165)–Venus-Flag (I and J) in Mad2-depleted cells were obtained as in A except that the Mad2 siRNA oligonucleotides were transfected during synchronization. Because inactivating the SAC accelerates progression from NEBD to anaphase (not depicted; Meraldi et al., 2004), we only considered those cells in which NEBD to anaphase was shortened from the 40 min in control cells to <20 min. Time is relative to NEBD (G and I) or anaphase (H and J). Error bars indicate mean ± SD of 10 cells (G and H) and 13 cells from three experiments (I and J).
Figure 4.
Figure 4.
Cyclin A–associated Cks1 increases the efficiency of cyclin A ubiquitylation. (A–D) Cells were injected in G2 phase with cyclin A (1–98)–Venus-Cks1 (A and B) or cyclin A (1–165)–Venus-Cks1 (C and D), and the fluorescence was measured through mitosis. Time is relative to NEBD (A and C) or anaphase (B and D). Error bars indicate mean ± SD of 19 cells from two experiments (A and B) or 24 cells from two experiments (C and D). (E) In vitro ubiquitylation assay of cyclin A (1–165)–Venus (lanes 1–9) or cyclin A (1–165)–Venus-Cks1 (lanes 10–19). Reactions were performed for the indicated time (shown in minutes) before analysis by SDS-PAGE and phosphoimaging. Control reactions are without APC/C (lanes 9 and 18) or E2 (lane 19). (F and G) Quantification of ubiquitin conjugates in E with one to five ubiquitin (F) and more than five ubiquitin (G) molecules were normalized to the total amount of ubiquitylated substrate. (F and G) Error bars indicate mean ± SEM from four experiments. (H) Ubiquitylation reactions for cyclin A (1–165)–Venus (lanes 1–4) and cyclin A (1–165)–Venus-Cks1 (lanes 5–8). 100 times excess of unlabeled cyclin A (1–165)–Venus (lanes 3 and 7) or cyclin A (1–165)–Venus-Cks1 (lanes 4 and 8) was added as a competitor at the beginning of the reaction. (I) Quantification of reactions in H. Numbers correspond to lanes in H. *, unmodified substrate; **, P < 0.01; ***, P < 0.05 (calculated using Student’s t test).
Figure 5.
Figure 5.
Cks directly recruits cyclin A to the APC/C. (A) Purified His6-Cks1 and an anion-binding site mutant (R20A) and fusion proteins between cyclin A (1–165)–Venus and wt or (R20A) mutant Cks1 were immobilized on beads and incubated with extract from nocodazole-treated HeLa cells. Beads were analyzed by SDS-PAGE and immunoblotted for APC3, cyclin A, and Cks1. Molecular mass markers are shown on the left (kilodaltons). (B) APC3 binding to Cks1 (A) was quantified on an Odyssey scanner and corrected for the amount of Cks1. Values were normalized to wt Cks1. Error bars indicate mean ± SEM from three experiments. (C and D) Degradation of cyclin A (1–165)–Venus-Cks1 (R20A) measured as in Fig. 4 (A and B). Time is relative to NEBD (C) or anaphase (D). Error bars indicate mean ± SD of 28 cells from two experiments. (E) Working model. The cyclin A–Cdk–Cks complex binds to soluble or APC/C-associated Cdc20 by out competing the SAC complex. Recruitment to the APC/C is mediated by Cks interaction with phosphorylated APC/C.

Similar articles

Cited by

References

    1. Bourne Y., Watson M.H., Hickey M.J., Holmes W., Rocque W., Reed S.I., Tainer J.A. 1996. Crystal structure and mutational analysis of the human CDK2 kinase complex with cell cycle-regulatory protein CksHs1. Cell. 84:863–874 10.1016/S0092-8674(00)81065-X - DOI - PubMed
    1. Clute P., Pines J. 1999. Temporal and spatial control of cyclin B1 destruction in metaphase. Nat. Cell Biol. 1:82–87 10.1038/10049 - DOI - PubMed
    1. den Elzen N., Pines J. 2001. Cyclin A is destroyed in prometaphase and can delay chromosome alignment and anaphase. J. Cell Biol. 153:121–136 10.1083/jcb.153.1.121 - DOI - PMC - PubMed
    1. Di Fiore B., Pines J. 2007. Emi1 is needed to couple DNA replication with mitosis but does not regulate activation of the mitotic APC/C. J. Cell Biol. 177:425–437 10.1083/jcb.200611166 - DOI - PMC - PubMed
    1. Gabellini D., Colaluca I.N., Vodermaier H.C., Biamonti G., Giacca M., Falaschi A., Riva S., Peverali F.A. 2003. Early mitotic degradation of the homeoprotein HOXC10 is potentially linked to cell cycle progression. EMBO J. 22:3715–3724 10.1093/emboj/cdg340 - DOI - PMC - PubMed

Publication types

MeSH terms