. 2010 Aug 23;190(4):613-21.
doi: 10.1083/jcb.201005007.

Structure of hibernating ribosomes studied by cryoelectron tomography in vitro and in situ

Affiliations

Structure of hibernating ribosomes studied by cryoelectron tomography in vitro and in situ

Julio O Ortiz et al. J Cell Biol. .

Abstract

Ribosomes arranged in pairs (100S) have been related with nutritional stress response and are believed to represent a "hibernation state." Several proteins have been identified that are associated with 100S ribosomes but their spatial organization has hitherto not been characterized. We have used cryoelectron tomography to reveal the three-dimensional configuration of 100S ribosomes isolated from starved Escherichia coli cells and we have described their mode of interaction. In situ studies with intact E. coli cells allowed us to demonstrate that 100S ribosomes do exist in vivo and represent an easily reversible state of quiescence; they readily vanish when the growth medium is replenished.


Figures
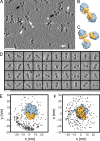
Figure 1.
Figure 1.
Variability in the spatial relationship of identified ribosomes within tomograms of starved E. coli lysates. (A) XY slice of tomogram (bar, 100 nm). White arrows indicate 100S particles and black arrows ribosomal trimers. Isosurfaces of a reference ribosome (30S, yellow; 50S, blue) were placed in relative orientations found by template matching for the examples of a dimer (B) and a trimer (C) indicated by asterisks in A. (D) Gallery of representative 100S particles detected in different tomograms (bar, 50 nm). (E and F) Center-to-center 3D distance vectors (black dots) between each ribosome and its next neighbor, depicted by x-y and x-z plots. The plot corresponds to the subset of 271 ribosomes with one or more ribosomal neighbors from 1,232 identified ribosomes. Red dots represent the centers of clusters observed in densely packed polysomes (Brandt et al., 2009).
Figure 2.
Figure 2.
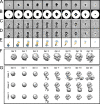
Alignment and classification of identified ribosomes in tomograms from starved E. coli lysates. (A–E) Reference-based alignment and classification using constrained correlation. (A) Slices of the average structure derived from 1,232 subtomograms (Pool II) containing 70S ribosomes. (B) Mask used for classification excluding the aligned central ribosome. (C and D) Slices of average structures containing 100S ribosomes with the two ribosomes in a preferred orientation derived from 43 classified subtomograms from Pool II and 35 classified subtomograms from Pool I, respectively. (E) Schematic slices of the two ribosomes oriented as in C (50S, blue; 30S, yellow; light colors for central ribosome excluded during classification; dark colors adjacent particle revealed after classification). (F and G) Unsupervised alignment and classification using a maximum likelihood approach. (F) Isosurface representation of 3D maps obtained during iterative reference-free alignment of 601 subtomograms (Pool I) that were windowed to contain only a single ribosome particle. Iteration 0 (iter 0) corresponds to the initial, unbiased reference that was obtained by averaging over all sub-tomograms in random orientations. The final map (iter 15) has a resolution of 38 Å according to the FSC = 0.5 criterion and is readily identified as a 70S ribosome particle. (G) Simultaneous alignment and classification of the same particles used in F, but without windowing in order to include neighboring ribosomes. Three initial reference structures (class 1–3, iter 0) were refined simultaneously during 25 iterations. Note that during the first 5 iterations similarity between the three references was imposed. The final averages (iter 25) were interpreted as class 1 trimers (or larger clusters, 74 particles), class 2 dimers (158 particles), and class 3 monomers of 70S ribosome (369 particles).
Figure 3.
Figure 3.
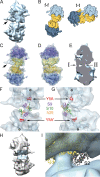
Interaction regions between small subunits of the 100S ribosome. (A) “Top” view of the averaged 100S ribosome density map. (B) Schematic representation of large (blue) and small (yellow) subunits in the f-f ribosomal arrangement found in starvation conditions, and the t-t organization characteristic for stalled polysomes. (C and D) Docking of 70S ribosome crystal structure (Schuwirth et al., 2005) into the two ribosomal particles of the 100S ribosome map in “top” and “right” views, respectively. An unassigned density protrudes close to the exit of the mRNA tunnel (A and C, arrows). (E) Two major contact regions between the ribosomes in the 100S particles are conspicuous in a longitudinal cut the map in the “right” view (I and II). Docking of the YfiA–70S ribosome complex (Vila-Sanjurjo et al., 2004) into the 100S density map suggests that proteins S9, S10, and helix 39 of the 16S rRNA are in the contact region I (F and G, “top” and “right” view, respectively). S9 and S10 have domains which extend toward the YfiA binding site. The suggested ribosomal binding sites for RMF are also indicated (gray dots; Yoshida et al., 2002, 2004). (H) “Bottom” view of the 100S ribosome density map with contact region II highlighted in blue. (I) In the docked 70S ribosome crystal structure (Schuwirth et al., 2005), protein S2 is located outside the map envelop adjacent to the contact region II (view corresponds to detail in H).
Figure 4.
Figure 4.
100S Ribosomes identified in situ. (A) Slice of a tomogram of an intact E. coli cell grown in minimal media (bar, 100 nm). Longitudinal (B) and transversal (C) views of corresponding isosurface representation. Models of 70S ribosomes with colored 30S (yellow) and 50S subunits (blue) are positioned where ribosome dimers were detected. The inner and outer membranes were manually segmented (dark and light brown, respectively), and were the basis of a membrane model (black grid). Manually segmented Pili are depicted in green. (D) A magnified tomographic section through a single ribosome dimer. (E) Surface rendering of a model ribosome dimer replacing the ribosomes shown in D (bar, 50 nm). (F–H) x-y plots of center-to-center 3D distance vectors between each ribosome and its closest ribosome neighbor. Plots correspond to representative tomograms for three different growth conditions: exponential phase (F), stationary phase (G), and grown to stationary phase but supplemented with amino acids (H). Filled dots correspond to particles clustered based on center-to-center vectors and relative orientations, circles represent single ribosomes. Only in stationary phase can a distinct cluster be observed. Two ribosome copies are clearly distinguishable in an XY slice (I) and the isosurface representation of an average of 878 subvolumes containing ribosome dimers extracted from tomograms of E. coli in stationary phase (J).
Figure 5.
Figure 5.
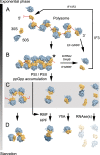
Model for the changes in ribosomal clustering coupled to growth conditions in E. coli. During transitions from exponential phase (top) to starvation (bottom), relaxed translating polysomes (A) might assume an ordered arrangement (B) when one or more 70S ribosomes become stalled (*). The recycling of ribosomal subunits at canonical stop codons is performed by the EF-G and RRF, while trans-translation (tmRNA/SmpB system) or possible IF3/RRF interactions disassemble stalled ribosomes. In response to nutrient scarcity, empty tRNAs bound to stalled ribosomes induced a stringent response mediated by PSI/PSII, with a consequent accumulation of ppGpp. In turn, this alarmon induces transcription of several genes including the rmf gene. RMF inhibit ribosome translation and together with the HPF promote the formation of dimers (D), it is unknown which state of the ribosome (C) is their targets. YfiA binds 70S ribosomes. Endonucleases are responsible for the initial degradation steps of dissociated 50S and 30S ribosomal subunits under starvation, while the 70S and ribosomal dimers likely remain stable.

Similar articles

Cited by

References

    1. Brandt F., Etchells S.A., Ortiz J.O., Elcock A.H., Hartl F.U., Baumeister W. 2009. The native 3D organization of bacterial polysomes. Cell. 136:261–271 10.1016/j.cell.2008.11.016 - DOI - PubMed
    1. Bremer H., Dennis P. 2008. Feedback control of ribosome function in Escherichia coli. Biochimie. 90:493–499 10.1016/j.biochi.2007.10.008 - DOI - PubMed
    1. Buchan J.R., Stansfield I. 2007. Halting a cellular production line: responses to ribosomal pausing during translation. Biol. Cell. 99:475–487 10.1042/BC20070037 - DOI - PubMed
    1. Cox J., Mann M. 2008. MaxQuant enables high peptide identification rates, individualized p.p.b.-range mass accuracies and proteome-wide protein quantification. Nat. Biotechnol. 26:1367–1372 10.1038/nbt.1511 - DOI - PubMed
    1. Fernández J.J., Sanjurjo J.R., Carazo J.M. 1997. A spectral estimation approach to contrast transfer function detection in electron microscopy. Ultramicroscopy. 68:267–295 10.1016/S0304-3991(97)00032-6 - DOI

Publication types

Substances