. 2010 Aug 23;190(4):693-706.
doi: 10.1083/jcb.201004082.

Feedback amplification of fibrosis through matrix stiffening and COX-2 suppression

Affiliations

Feedback amplification of fibrosis through matrix stiffening and COX-2 suppression

Fei Liu et al. J Cell Biol. .

Abstract

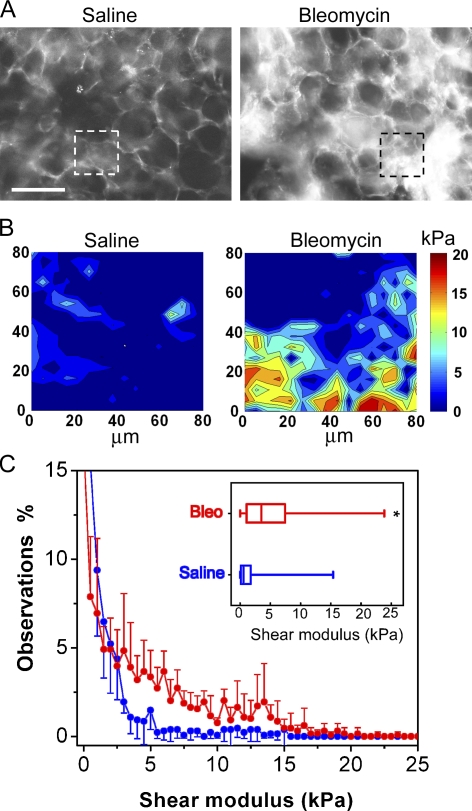
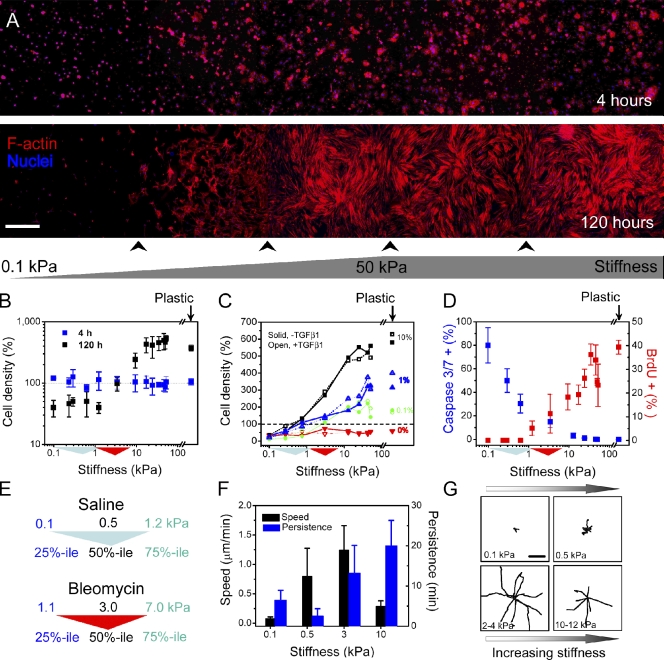
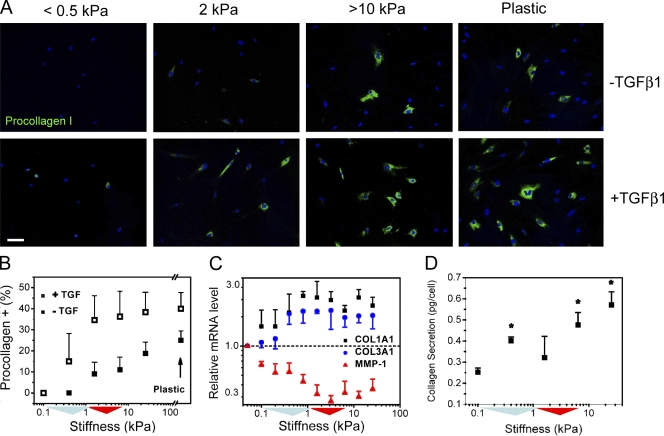
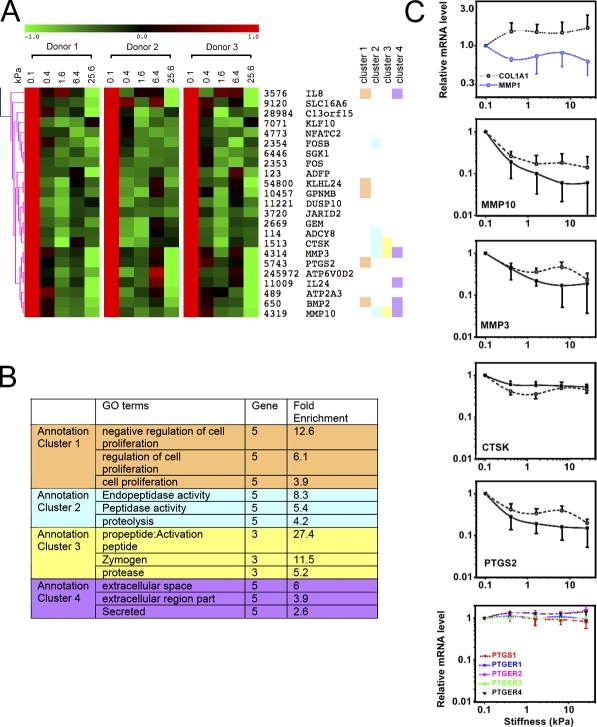
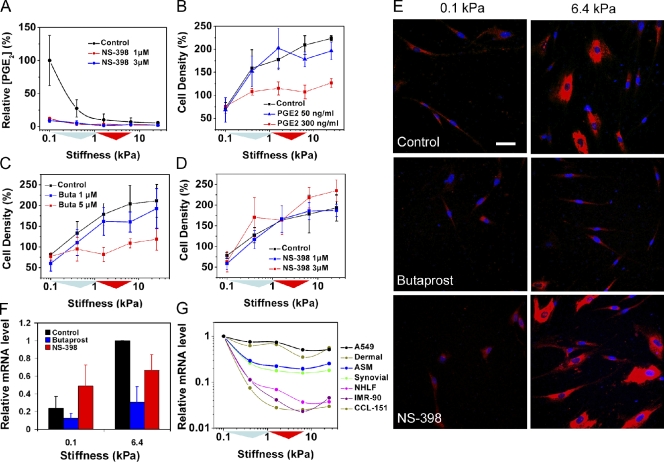
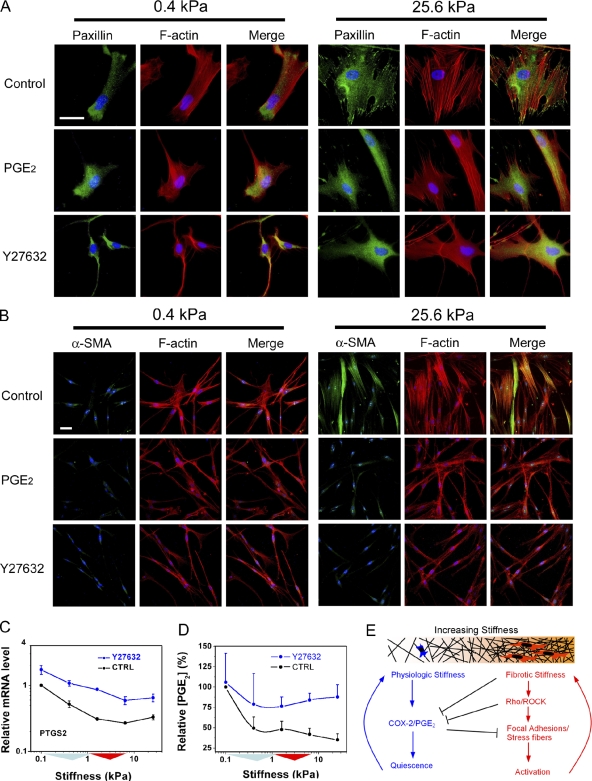
Tissue stiffening is a hallmark of fibrotic disorders but has traditionally been regarded as an outcome of fibrosis, not a contributing factor to pathogenesis. In this study, we show that fibrosis induced by bleomycin injury in the murine lung locally increases median tissue stiffness sixfold relative to normal lung parenchyma. Across this pathophysiological stiffness range, cultured lung fibroblasts transition from a surprisingly quiescent state to progressive increases in proliferation and matrix synthesis, accompanied by coordinated decreases in matrix proteolytic gene expression. Increasing matrix stiffness strongly suppresses fibroblast expression of COX-2 (cyclooxygenase-2) and synthesis of prostaglandin E(2) (PGE(2)), an autocrine inhibitor of fibrogenesis. Exogenous PGE(2) or an agonist of the prostanoid EP2 receptor completely counteracts the proliferative and matrix synthetic effects caused by increased stiffness. Together, these results demonstrate a dominant role for normal tissue compliance, acting in part through autocrine PGE(2), in maintaining fibroblast quiescence and reveal a feedback relationship between matrix stiffening, COX-2 suppression, and fibroblast activation that promotes and amplifies progressive fibrosis.


Figures

Figure 1.
Figure 1.
Fibrosis focally increases stiffness of lung parenchymal tissue. (A) Immunostaining of collagen I in fresh, unfixed saline (left)- and bleomycin (right)-treated mouse lung parenchyma. Bar, 100 µm. (B) Representative elastographs of saline (left)- and bleomycin (right)-treated mouse lung parenchyma. Maps were made from tissue in the respective regions of interest identified in A. The color bar indicates shear modulus. Darkest blue corresponds to shear modulus values between 0.05 and 2 kPa. (C) Occurrence frequency analysis of stiffness in saline- and bleomycin (Bleo)-treated lung tissue. Data indicate mean ± SD of stiffness measurements pooled from five animals each for normal and fibrotic groups in two independent bleomycin injection experiments. (Inset) Stiffness increases in fibrotic lung parenchyma presented as box and whisker plots, in which the vertical line within each box represents the median, the limits of each box represent the interquartile range, and the whiskers represent the maximum and minimum values. *, P < 0.0001 comparing stiffness of fibrotic versus normal lung parenchyma using the Mann-Whitney-Wilcoxon test.
Figure 2.
Figure 2.
Fibroblasts preferentially accumulate across stiffness gradient. (A) Human lung fibroblasts stained with phalloidin (red) to visualize F-actin and Hoechst 33342 (blue) to visualize nuclei. Cells attach uniformly across the stiffness gradient 4 h after seeding. After 120 h, fibroblasts accumulate preferentially to stiffest region, and cell morphology transitions from round to spread. Panorama images were generated by imaging the entire gel width along the stiffness gradient and then tiling five to seven adjacent pictures. Arrowheads below the image indicate stitching positions. (B) Cell density is constant across the gradient after 4 h, but by 120 h, cells dramatically accumulate at stiffness >3 kPa and are lost below this stiffness level (note logarithmic scale). Density values are normalized to the global mean at 4 h. (C) Serum but not TGF-β1 is required for stiffness-dependent cell accumulation. Serial dilutions of serum gradually attenuate the stiffness-dependent accumulation behavior (black, 10% FBS; blue, 1% FBS; green, 0.1% FBS; red, 0% FBS). 2 ng/ml exogenous TGF-β1 shows little effect on cell density (open symbols and dotted lines) at any serum concentration. (B and C) Dashed lines indicate that cell density values are normalized to the global average obtained at 4 h. (D) Quantification of substrate stiffness effects on fibroblast apoptosis (blue indicates percentage of cells exhibiting caspase 3/7 activity after 24-h serum deprivation) and proliferation (red indicates percentage of nuclei positive for BrdU incorporation in 10% FBS). Standard deviation is from three independent experiments. (E) In panels B–D, colored triangles along the x axis are used to indicate the interquartile and median stiffness values of lung parenchyma from saline (cyan)- or bleomycin (red)-treated mice. (F) Fibroblast migration speed and persistence vary along substrate stiffness as measured with time-lapse video microscopy. Error bars indicate SD from 12 cells for each condition from two independent experiments. (G) Fibroblast migration tracks on stiffness gradient gels obtained from time-lapse video microscopy. Digital images were taken every 2 min for a total of 5 h per experiment. Each wind rose plot shows centroid tracks from 7–10 representative cells from each indicated stiffness region, with the initial position of each track superimposed at a common origin. Bars: (A) 500 µm; (G) 50 µm.
Figure 3.
Figure 3.
Collagen synthesis increases across stiffness gradient. (A) Gradual increase of procollagen I protein expression in cells along the stiffness gradient. Nuclei are counterstained with Hoechst 33342 (blue). 2 ng/ml exogenous TGF-β1 shifts procollagen I protein expression to lower stiffness and enhances expression on stiffer substrate regions (10% FBS). Bar, 100 µm. (B) Quantification of substrate stiffness effects on procollagen I protein expression in the presence (open symbols) and absence (closed symbols) of 2 ng/ml exogenous TGF-β1 for cells grown in 10% FBS. (C) Expression of COL1A1 and COL3A1 transcripts increase with substrate stiffness, whereas MMP1 transcripts decrease with increasing stiffness for cells grown in 0.1% FBS. The dashed line indicates that the gene expression values are normalized to the values from the softest substrate. Error bars indicate SD from four replicate samples from one representative experiment. (D) Net collagen secretion per cell from fibroblasts grown on discrete stiffness gels over 72 h, cells grown in 1% FBS. *, P < 0.05 compared with 0.1 kPa. (B and D) Error bars indicate SD from two independent experiments. (B–D) Colored triangles along the x axis are used to indicate the interquartile and median stiffness values of lung parenchyma from saline (cyan)- or bleomycin (red)-treated mice.
Figure 4.
Figure 4.
Stiffness drives coordinated expression of a fibrogenic gene program. (A) Gene expression cluster of down-regulated transcripts in response to increasing substrate stiffness from NHLFs (0.1% FBS). Each row displays relative expression levels from three donors for each gene, which has a minimum coefficient variance of 0.2 per donor. Columns within each donor represent gene expression for stiffness effect at 0.1, 0.4, 1.6, 6.4, and 25.6 kPa. Genes are listed with their EntrezID, followed by their symbols according to the HUGO nomenclature. Hierarchical clustering is based on linear correlation across the three donors. (B) Top four annotation clusters from functional annotation clustering analysis of genes in A. Corresponding genes within each annotation cluster are marked with the same color next to the gene name in A. (C) Selected stiffness-regulated gene expression from array analysis. In panels with both solid and dashed lines, dashed lines represent array values averaged from three donors, and solid lines represent replicate analysis by real time qPCR using cells from donor 1. Data shown are means relative to the values at the stiffness 0.1 kPa. The final panel shows microarray data from three donors for PTGS1 and prostanoid receptors PTGER1–4. Error bars on dashed lines indicate SD from three donors; error bars on solid lines indicate SD from three independent experiments using cells from donor 1.
Figure 5.
Figure 5.
PGE2 regulates fibroblast responses to increasing stiffness. (A) Relative PGE2 levels in NHLF cell culture supernatants with and without selective COX-2 inhibitor (NS-398). (B–D) NHLF accumulation in discrete stiffness wells (1% FBS) and modification by exogenous PGE2, EP2 agonist (butaprost; Buta), and COX-2 inhibitor (NS-398), respectively. (E) Immunostaining for procollagen I in NHLFs (1% FBS). EP2 agonist (5 µM butaprost) abrogates the stiffness effect on procollagen I expression, whereas COX-2 selective inhibitor (3 µM NS-398) is unable to augment procollagen I expression at low stiffness. Bar, 50 µm. (F) Relative mRNA levels for COL1A1, assessed by qPCR, on 0.1 and 6.4 kPa substrates (0.1% FBS) with and without 5 µM butaprost or 3 µM NS-398. (A–D and F) Error bars indicate SD from three independent experiments for each panel. (G) COX-2 (PTGS2) mRNA levels decrease across stiffness, as measured by qPCR, in A549 human lung epithelial cells, primary human dermal, synovial and lung (NHLF) fibroblasts, and airway smooth muscle (ASM) cells, as well as CCL-151 and IMR90 lung fibroblast cell lines (0.1% FBS). (A–D and G) Colored triangles along the x axis are used to indicate the interquartile and median stiffness values of lung parenchyma from saline (cyan)- or bleomycin (red)-treated mice.
Figure 6.
Figure 6.
ROCK and PGE2 exert mutually antagonistic effects on fibroblasts. (A) Increasing stiffness enhances organization of filamentous F-actin cytoskeleton (red) and triggers formation of paxillin-positive focal adhesions (green). The effect of stiffness on formation of these cellular structures is reversed with 30 ng/ml exogenous PGE2, in a fashion identical to treatment with 33 µM of the ROCK inhibitor Y27632 (1% FBS). (B) Increasing stiffness drives expression and assembly of α-SMA (green) into F-actin stress fibers (red). The effect of stiffness on α-SMA is reversed with 30 ng/ml exogenous PGE2, in a fashion identical to treatment with 33 µM of the ROCK inhibitor Y27632 (1% FBS). (C) 33 µM Y27632 increases expression of COX-2 (PTGS2) mRNA across matrix stiffness conditions (0.1% FBS), relative to untreated cells (CTRL). Error bars indicate SD from three replicate samples from one representative experiment. (D) 33 µM Y27632 equilibrates endogenous PGE2 levels across matrix stiffness conditions (0.1% FBS), relative to untreated cells (CTRL). Error bars indicate SD from three independent experiments. (C and D) Colored triangles along the x axis are used to indicate the interquartile and median stiffness values of lung parenchyma from saline (cyan)- or bleomycin (red)-treated mice. (E) Results are consistent with mutually antagonistic and self-reinforcing effects of Rho/ROCK and COX-2/PGE2 signaling in fibroblasts. Under normal conditions, autocrine PGE2 and PGE2 contributions from surrounding cells, coupled with the compliant nature of the normal matrix, maintain fibroblasts in a quiescent state. Increasing matrix stiffness suppresses endogenous COX-2 and shifts fibroblasts into an activated state. Subsequent matrix synthesis generates positive feedback on matrix synthesis, leading to persistent fibroblast activation and progressive matrix stiffening. Bars, 50 µm.

References

    1. Arora P.D., Narani N., McCulloch C.A. 1999. The compliance of collagen gels regulates transforming growth factor-beta induction of alpha-smooth muscle actin in fibroblasts. Am. J. Pathol. 154:871–882 - PMC - PubMed
    1. Assoian R.K., Klein E.A. 2008. Growth control by intracellular tension and extracellular stiffness. Trends Cell Biol. 18:347–352 10.1016/j.tcb.2008.05.002 - DOI - PMC - PubMed
    1. Bachofen H., Scherrer M. 1967. Lung tissue resistance in diffuse interstitial pulmonary fibrosis. J. Clin. Invest. 46:133–140 - PMC - PubMed
    1. Bergner A., Sanderson M.J. 2003. Airway contractility and smooth muscle Ca(2+) signaling in lung slices from different mouse strains. J. Appl. Physiol. 95:1325–1332 - PubMed
    1. Bonner J.C., Rice A.B., Ingram J.L., Moomaw C.R., Nyska A., Bradbury A., Sessoms A.R., Chulada P.C., Morgan D.L., Zeldin D.C., Langenbach R. 2002. Susceptibility of cyclooxygenase-2-deficient mice to pulmonary fibrogenesis. Am. J. Pathol. 161:459–470 - PMC - PubMed

Publication types

MeSH terms