. 2010 Nov 18;116(20):4175-84.
doi: 10.1182/blood-2010-01-266098. Epub 2010 Aug 23.

Th17 immune responses contribute to the pathophysiology of aplastic anemia

Affiliations

Th17 immune responses contribute to the pathophysiology of aplastic anemia

Regis Peffault de Latour et al. Blood. .

Abstract

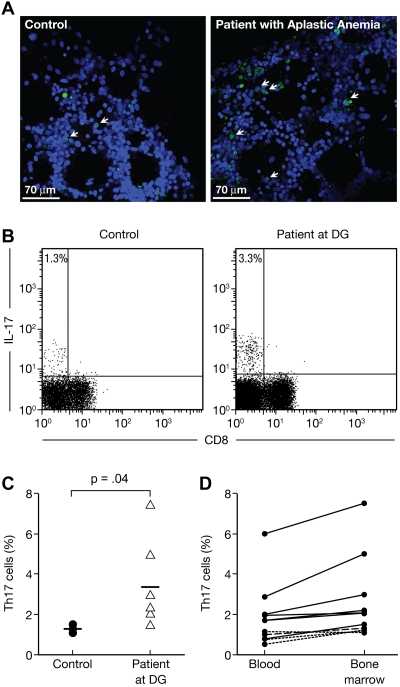
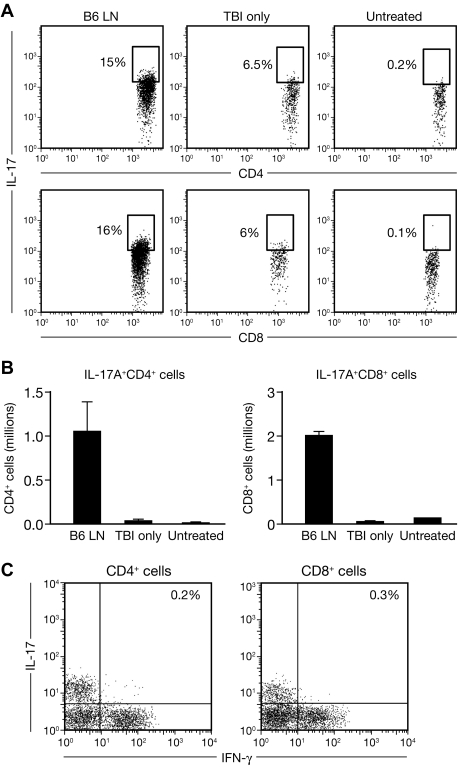
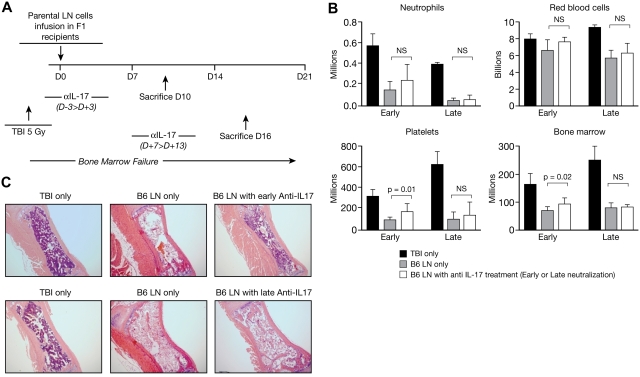
T helper type 17 (Th17) cells have been characterized based on production of interleukin-17 (IL-17) and association with autoimmune diseases. We studied the role of Th17 cells in aplastic anemia (AA) by isolating Th17 cells from patients blood (n = 41) and bone marrow (BM) mononuclear cells (n = 7). The frequency and total number of CD3(+)CD4(+)IL-17-producing T cells were increased in AA patients at presentation compared with healthy controls (P = .0007 and .02, respectively) and correlated with disease activity. There was an inverse relationship between the numbers of Th17 cells and CD4(+)CD25(high)FoxP3(+) regulatory T cells (Tregs) in the blood of AA patients. Concomitant with the classical Th1 response, we detected the presence of CD4(+) and CD8(+) IL-17-producing T cells in a mouse model of lymph node infusion-induced BM failure. Although anti-IL-17 treatment did not abrogate BM failure, early treatment with the anti-IL-17 antibody reduced the severity of BM failure with significantly higher platelet (P < .01) and total BM cell (P < .05) counts at day 10. Recipients that received anti-IL-17 treatment had significantly fewer Th1 cells (P < .01) and more Treg cells (P < .05) at day 10 after lymph node infusion. Th17 immune responses contribute to AA pathophysiology, especially at the early stage during disease progression.


Figures

Figure 1
Figure 1
Increased frequencies of Th17 cells in the BM of aplastic patients (AA) at diagnosis. BM from 2 patients (1 moderate and 1 severe AA) and 1 healthy control were stained with 4,6-diamidino-2-phenylindole and anti-IL-17 and then analyzed using confocal microscopy. BMMCs from healthy controls (n = 4) and AA patients at diagnosis (n = 7) were stained with anti-CD3 and anti-CD8 antibodies followed by intracellular staining with anti-IL-17 antibody. Cells were analyzed by flow cytometry after stimulation for 6 hours with PMA and ionomycin in the presence of monensin. (A) Representative confocal analysis of the BM from healthy control (top panel) and AA patient (bottom panel). (B) Representative flow cytometric analysis of IL-17 expressions in CD8 T-cell subsets (Th17 cells) in healthy control (left panel) as well as in AA at diagnosis (right panel). The mean value of each group is indicated. (C) Frequencies of Th17 cells in healthy controls (●, n = 4) and in AA at diagnosis (▵, n = 7). The mean value of each group is represented (solid line). (D) Correlation between the frequencies of PBMC and BMMC Th17 cells in AA at diagnosis (n = 7). Normal donors (4 healthy controls) are represented by a dashed line.
Figure 2
Figure 2
Frequencies and numbers of Th17 cells in aplastic patients (AA) correlate with disease activity. PBMCs from healthy controls (n = 10) and AA patients (AA) at diagnosis (n = 18), in CR (n = 12) or in PRs (n = 12) were stained with anti-CD3 and anti-CD8 antibodies followed by intracellular IL-17 antibody and examined by flow cytometry after stimulation for 6 hours with PMA and ionomycin. (A) Representative flow cytometric analysis of IL-17 expression in CD8 T-cell subsets (Th17 cells) in healthy control (left panel) as well as in AA at diagnosis (left middle panel), in CR (right middle panel), or in PR (right panel). The mean value of each group is indicated. (B) Frequencies of Th17 cells in healthy controls (●) and in AA at diagnosis (▵), in CR (▴) and in PR (○). The mean value of each group is represented (solid line). (C) Absolute numbers of Th17 cells in healthy controls (●) and in AA at diagnosis (▵), in CR (▴) and in PR (○). The mean value of each group is represented (solid line). (D) Frequencies (left panel) and absolute numbers (right panel) of Th17 cells in patients who obtained a CR. Normal values are indicated by gray bars. (E) Frequencies (left panel) and absolute numbers (right panel) of Th17 cells in patients who were PRs. Normal values are indicated by gray bars.
Figure 3
Figure 3
Expansion of the Th17 cell population correlates with the depletion of natural regulatory T cells. PBMCs from healthy controls (n = 10) and AA patients at diagnosis (n = 21), in CR (n = 12), or in PRs (n = 15) were stained with anti-CD3, anti-CD4, anti-CD25 antibodies followed by intracellular FOXP3 antibody and examined by flow cytometry. Correlation between CD4+CD25highFOXP3+ T cells (natural regulatory T cells) and CD8 IL-17+ T cells (Th17 cells) was studied according to the stage of the disease. Frequencies of natural regulatory T cells and Th17 cells are indicated in healthy controls (●) and in AA at diagnosis (▵), in complete remission (▴), and in PR AA (○).
Figure 4
Figure 4
Induction of BM failure with T-cell expansion in a mouse model. CByB6F1 mice (n = 5) were irradiated (5 Gy TBI) and injected with 5 × 10⁶ B6 LN cells and then bled and killed 10 days later along with untreated control mice (irradiated non–LN-injected, TBI-only, n = 5; non-irradiated non–LN-injected, untreated, n = 5). CBCs were performed using a Hemavet analyzer. BM cells were stained with anti-CD4 and anti-CD8 antibodies and examined by flow cytometry. Experiments are represented as mean ± SD. P less than .05 is considered statistically significant. (A) Representative flow cytometric analysis of IL-17 expressions in CD4+ (top panel) and CD8+ (bottom panel) T-cell subsets (Th17 cells) in B6LN, TBI-only, and untreated mice. The mean value of each group is indicated. (B) Absolute numbers of CD4+ (top panel) and CD8+ (bottom panel) T-cell subsets (Th17 cells) in B6 LN, TBI-only, and untreated mice. Experiments are represented as mean ± SD. (C) Representative flow cytometric analysis of IL-17 and IFN-γ coexpression in CD4+ (top panel) and CD8+ (bottom panel) T-cell subsets (Th17 cells) in B6 LN mice. The mean value of each group is indicated.
Figure 5
Figure 5
Increase frequencies and numbers of Th17 cells during the induction of BM failure in the mouse. CByB6F1 mice were irradiated (5 Gy TBI) and injected with 5 × 10⁶ B6 LN cells. Three B6 LN mice as well as 3 controls (irradiated non–LN-injected, TBI-only) were killed at days 7, 10, 15, and 19 after LN injection. At each time point, BMMCs were stained with anti-CD4, anti-CD8 followed by intracellular IL-17, and IFN-γ antibody and examined by flow cytometry. Experiments are represented as mean ± SD. (A) Absolute numbers of CD4+ (top panel) and CD8+ (bottom panel) cells in the BM of B6 LN and control mice (TBI-only) at the indicated days after LN injection. (B) Representative flow cytometric analysis at day 15 of IFN-γ (top panels) and IL-17 (bottom panels) expression in CD4+ (left panels) and CD8+ (right panel) subsets, in TBI-only and LN B6 mice. The mean value of each group is indicated. (C) Absolute numbers of IL-17+ and IFN-γ+ cells in CD4+ (top panel) and CD8+ (bottom panel) compartment at the indicated days. Experiments are represented as mean plus or minus SD.
Figure 6
Figure 6
Early inhibition of Th17 cells with neutralizing anti–IL-17 antibody delays the induction of BM failure in mice. Anti–IL-17 was administered at 100 μg intraperitoneally on alternating days (4 total injections) to the BM failure induction mouse model. Early anti–IL-17 neutralization consisted of 100 μg intraperitoneal injections on alternating days from 3 days before the LN injection to 3 days after (n = 5). Controls consisted of LN-injected mice (n = 3) and mice only irradiated (n = 2). Late anti–IL-17 neutralization consisted of 100 μg intraperitoneal injections on alternating days from 7 to 13 days after LN injections (n = 5). Controls consisted of LN-injected mice (n = 3) and mice only irradiated (n = 2). CBCs were performed using a Hemavet analyzer. Sternebrae were sectioned, hematoxylin and eosin–stained, and photographed. Experiments are represented as mean ± SD. P <.05 is considered statistically significant. (A) Schema of the anti–IL-17 neutralization experiment. (B) CBCs and total BM cells in TBI-only, B6 LN, and in B6 LN with anti–IL-17 antibody mice after early or late neutralization. (C) Representative hematoxylin and eosin sternebrae section (original magnification ×4) in TBI-only, B6 LN, and B6 LN with anti–IL-17 antibody after early (top panels) or late (bottom panels) neutralization.
Figure 7
Figure 7
Mice treated with early anti–IL-17 antibody have an increased percentage of Tregs in the BM and decreased IFN-γ levels in the plasma at day 10. CByB6F1 mice were irradiated (5 Gy TBI) and injected with 5 × 10⁶ B6 LN cells. Early anti-IL-17 neutralization consisted of 100-μg intraperitoneal injections on alternating days from 3 days before the LN injection to 3 days after (n = 5). Controls consisted of LN-injected mice (n = 3) and mice only irradiated (n = 2). CD4+ and CD8+ BM cells were assessed at day 10 for IL-17 and IFN-γ expression. CD4+FOXP3+ cells were also measured. Cytokine levels in the plasma were measured by enzyme-linked immunosorbent assay. White bars represent the group of mice who did not receive anti–IL-17 neutralization; gray bars, mice that did receive anti–IL-17 neutralization; and black bars, TBI-only controls. (A) Absolute numbers of IL-17+ and IFN-γ+ cells in CD4+ (left panel) and CD8+ (right panel) subsets at day 10, according to the anti–IL-17 neutralization. Experiments are represented as mean ± SD. (B) Frequencies of CD4+ FOXP3+ cells. Experiments are represented as mean ± SD. (C) Cytokine levels in the plasma measured by enzyme-linked immunosorbent assay at day 10. Experiments are represented as mean ± SD.

Comment in

Similar articles

Cited by

References

    1. Harrington LE, Hatton RD, Mangan PR, et al. Interleukin 17-producing CD4+ effector T cells develop via a lineage distinct from the T helper type 1 and 2 lineages. Nat Immunol. 2005;6(11):1123–1132. - PubMed
    1. Park H, Li Z, Yang XO, et al. A distinct lineage of CD4 T cells regulates tissue inflammation by producing interleukin 17. Nat Immunol. 2005;6(11):1133–1141. - PMC - PubMed
    1. Yen D, Cheung J, Scheerens H, et al. IL-23 is essential for T cell-mediated colitis and promotes inflammation via IL-17 and IL-6. J Clin Invest. 2006;116(5):1310–1316. - PMC - PubMed
    1. Bettelli E, Oukka M, Kuchroo VK. T(H)-17 cells in the circle of immunity and autoimmunity. Nat Immunol. 2007;8(4):345–350. - PubMed
    1. Kolls JK, Linden A. Interleukin-17 family members and inflammation. Immunity. 2004;21(4):467–476. - PubMed

Publication types

MeSH terms