. 2010 Oct;19(10):1967-77.
doi: 10.1002/pro.485.

The lambda spanin components Rz and Rz1 undergo tertiary and quaternary rearrangements upon complex formation

Affiliations

The lambda spanin components Rz and Rz1 undergo tertiary and quaternary rearrangements upon complex formation

Joel Berry et al. Protein Sci. 2010 Oct.

Abstract

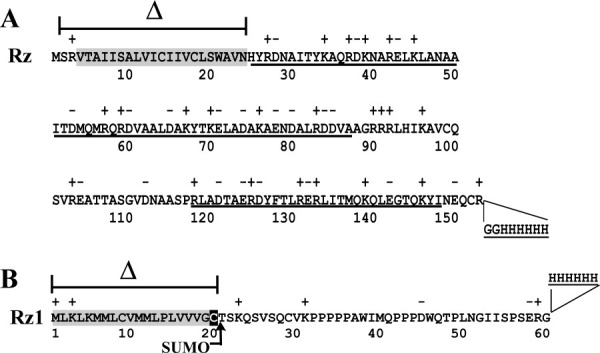
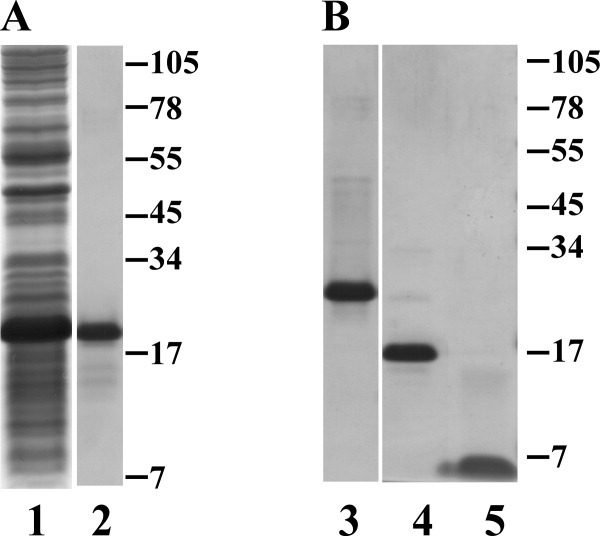
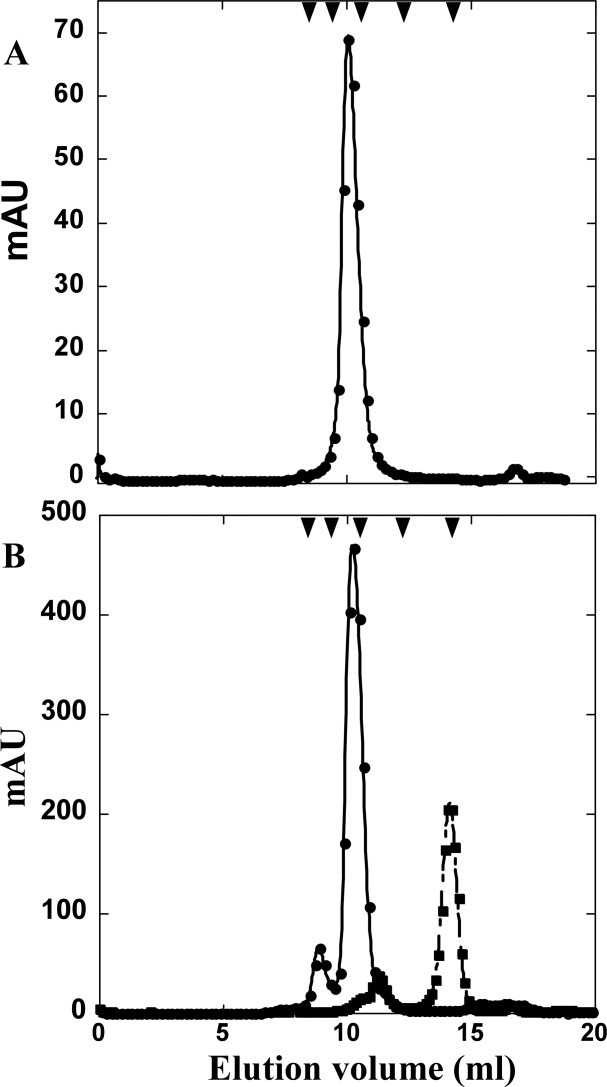
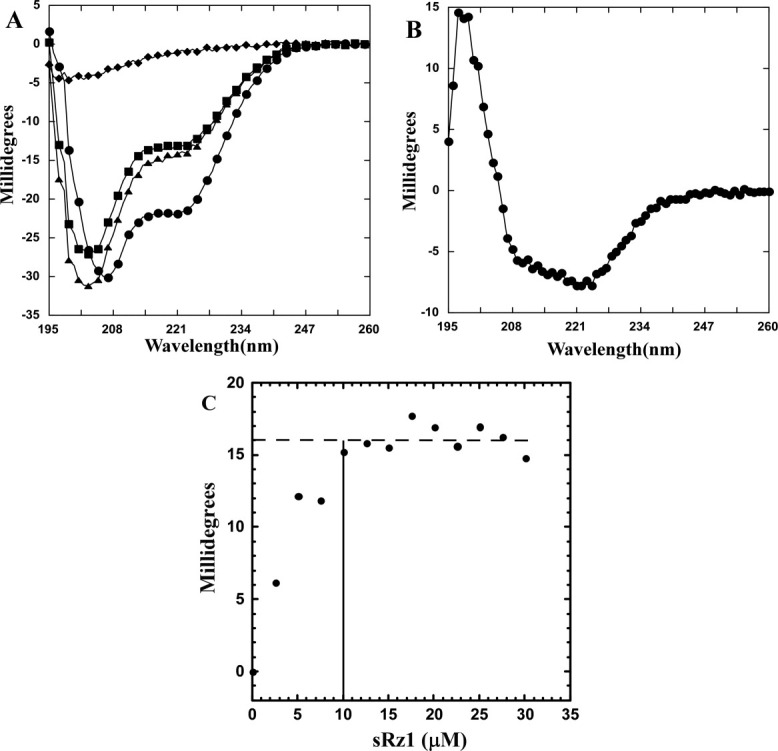
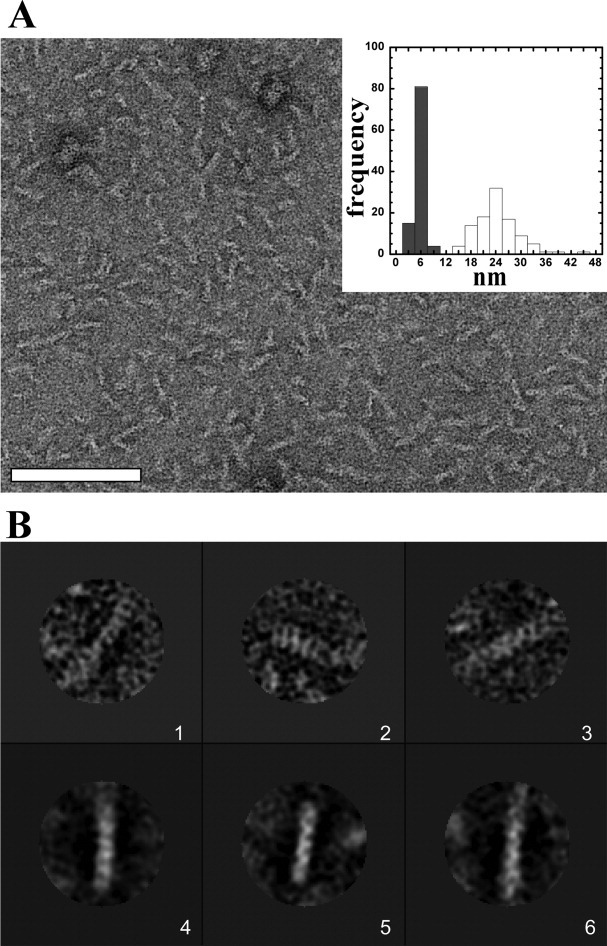
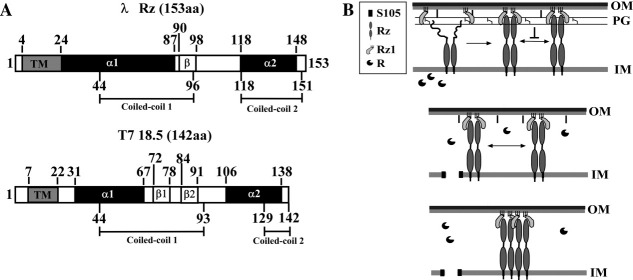
Phage holins and endolysins have long been known to play key roles in lysis of the host cell, disrupting the cytoplasmic membrane and peptidoglycan (PG) layer, respectively. For phages of Gram-negative hosts, a third class of proteins, the spanins, are involved in disrupting the outer membrane (OM). Rz and Rz1, the components of the lambda spanin, are, respectively, a class II inner membrane protein and an OM lipoprotein, are thought to span the entire periplasm by virtue of C-terminal interactions of their soluble domains. Here, the periplasmic domains of Rz and Rz1 have been purified and shown to form dimeric and monomeric species, respectively, in solution. Circular dichroism analysis indicates that Rz has significant alpha-helical character, but much less than predicted, whereas Rz1, which is 25% proline, is unstructured. Mixture of the two proteins leads to complex formation and an increase in secondary structure, especially alpha-helical content. Moreover, transmission electron-microscopy reveals that Rz-Rz1 complexes form large rod-shaped structures which, although heterogeneous, exhibit periodicities that may reflect coiled-coil bundling as well as a long dimension that matches the width of the periplasm. A model is proposed suggesting that the formation of such bundles depends on the removal of the PG and underlies the Rz-Rz1 dependent disruption of the OM.


Figures

Figure 1
Figure 1
The primary structure of λRz and Rz1. (A) Rz. The predicted N-terminal TMD and α-helical regions are highlighted and underlined, respectively. The region of Rz deleted during the construction of pSRzH6 (see “Materials and methods”) is indicated by a cross bar and Δ symbol. The sequence and location of the C-terminal oligohistidine tag are also indicated. (B) Rz1. The predicted lipoprotein signal sequence is highlighted in grey with the processed Cys residue highlighted in black. The region of Rz1 deleted during the construction of pSUMOφsRz1H6 (see “Materials and Methods”) is indicated by a cross bar and Δ symbol. The locations at which a SUMO and oligohistidine tag were fused to the Rz1 protein during construction of pSUMOφsRz1H6 is indicated by an arrow and two lines, respectively.
Figure 2
Figure 2
Purification of the Rz and Rz1 periplasmic domains. (A) Coomassie blue-stained SDS gels showing total protein from the crude lysate following overexpression of sRz (lane 1) and IMAC-pooled elution fractions (lane 2). MW standards expressed in kilodaltons are indicated to the right of lane 2. (B) Coomassie blue-stained SDS gels showing total protein from pooled IMAC elution fractions following overexpression of SUMOφsRz1 (lane 3), freed SUMO tag (lane 4), and sRz1 protein (lane 5) following ULPI cleavage and gel filtration, see Figure 3(B). MW standards expressed in kilodaltons are indicated to the right of lane 5.
Figure 3
Figure 3
S-75 gel filtration of sRz and sRz1. (A) Elution profile of sRz (•). (B) Elution profiles of SUMOφsRz1 (•) and SUMOφsRz1 ULPI cleavage reaction (▪). S-75 standards are indicated by arrow heads, from left to right: 75, 44, 29, 13.7, and 6.5 kDa.
Figure 4
Figure 4
sRz and sRz1 complex results in increased alpha-helical content. (A) CD analysis of sRz, sRz1, and sRz–sRz1 mixture. The individual sRz (▪) and sRz1 (♦) spectrum at a final concentration of 20 and 5 μM, respectively. Theoretical spectrum for non-interacting sRz and sRz1 (▴). Spectrum for a 4:1 molar ratio (20 μM sRz:5 μM sRz1) mixture of sRz and sRz1 (•). (B) Difference plot for sRz–sRz1 complex. Spectrum shown was generated by subtracting spectrum of the sRz–sRz1 mixture from the sum of the individual sRz and sRz1spectra. (C): Titration of complex formation by change in alpha-helical content. A solution of sRz (10 μM) was titrated with a concentrated stock of sRz1 in 2.5 μM increments and the change in ellipticity at 222 nm was monitored. A horizontal dotted line indicates the mean millidegree value (16.1) for those points that reside in the plateau region of the spectrum. A solid vertical line indicates the lowest concentration of sRz1 that falls within the standard deviation (0.9) of points within plateau region. Spectra were corrected for dilution and ellipticity of the sRz1 stock solution alone.
Figure 5
Figure 5
Apparent proteolysis of Rz in whole cells lacking Rz1 expression. Probing of total cellular protein with an anti-Rz antibody following SDS-PAGE. The plasmids pRE (lane 1), pRz (lane 2), and pRzRz1 (lane 3) were induced. An arrow indicates the position of the Rz degradation product in lane 2 as well as the full-length Rz protein in lanes 2 and 3. MW standards expressed in kilodaltons are indicated to the left of the western blot.
Figure 6
Figure 6
TEM and single particle analysis of sRz–sRz1 complex. (A) The sRz–sRz1 complex is an extended rod-shaped structure. Image is of a negative-stained sample containing a 4:1 molar ratio of sRz:sRz1 (6.3 μM sRz: 1.5 μM sRz1 or 0.1 mg mL total protein). Inset is a histogram representing the length (white bars) and width (grey bars) distribution of the sRz–sRz1 complexes. Scale bar is 100 nm. (B) Single particles and characteristic class averages of the sRz–sRz1 complex. Panels 1-3 are single particles and panels 4-6 are class averages. Scale bar is 10 nm.
Figure 7
Figure 7
Determination of periplasmic dimensions using cryo-electron microscopy. E. coli K-12 cells in logarithmic phase were plunged into liquid ethane and imaged by cryo-electron microscopy. Shown is a representative whole, frozen-hydrated cell with an inset box indicating the region of interest. The average distance between the inner and outer membranes at the mid-length of 31 such cells was 25.5 ± 3.1 nm. The periplasmic distance increases at the poles as shown in this example.
Figure 8
Figure 8
Coiled-coil propensity of the large spanin subunit and lateral oligomerization model for the spanin complex. (A) The location of potential coiled-coil regions within λRz and T7 18.5 is indicated by amino acid position underneath the respective illustration. The amino acid positions of relevant secondary structure features are indicated above the illustrations and are based on previously published predictions. (B) Three step model for lambda lysis. The molecules involved are: the holin, S105, shown as an integral membrane protein (black boxes); the endolysin, R, shown as globular soluble protein with a wedge-shaped cavity, representing the murein transglycosylase active site; Rz, a type II integral membrane protein with an N-terminal TMD (black rectangles) and a periplasmic domain with two predicted alpha-helical domains (ovals); and Rz1, a small OM lipoprotein shown as a crescent shape tethered to the membrane by three lines representing the three fatty acyl groups that decorate the N-terminal Cys residue. As illustrated in the upper panel, the C-terminal end of each subunit constituting the Rz dimer is unordered before Rz1 binding. Following formation of the spanin complex via C-terminal interactions between Rz and Rz1, the PG blocks the lateral diffusion and thus interaction of Rz–Rz1 complexes. The R protein is shown escaping through a hole formed by triggering of the holin S105 and attacking the PG (middle panel). This leads to at least local destruction of the PG (middle panel). In turn, this allows lateral diffusion of Rz–Rz1 complexes and oligomeric bundling of Rz–Rz1 complexes (lower panel). Other important features of the envelope, including the IM, the network of PG, the OM, and the major OM lipoprotein Lpp, attached covalently to the PG, are shown for context. The dark gray portion of the OM represents the lipopolysaccharide layer.

References

    1. Berry J, Summer EJ, Struck DK, Young R. The final step in the phage infection cyclfe: the Rz and Rz1 lysis proteins link the inner and outer membranes. Mol Microbiol. 2008;70:341–351. - PMC - PubMed
    1. Young R, Wang IN. Phage lysis. In: Calendar R, editor. The bacteriophages. Oxford: Oxford University Press; 2006. pp. 104–126.
    1. Dewey JS, Savva CG, White RL, Vitha S, Holzenburg A, Young R. Micron-scale holes terminate the phage infection cycle. Proc Natl Acad Sci USA. 2010;107:2219–2223. - PMC - PubMed
    1. Casjens S, Eppler K, Parr R, Poteete AR. Nucleotide sequence of the bacteriophage P22 gene 19 to 3 region: identification of a new gene required for lysis. Virology. 1989;171:588–598. - PubMed
    1. Young R, Way J, Way S, Yin J, Syvanen M. Transposition mutagenesis of bacteriophage lambda: a new gene affecting cell lysis. J Mol Biol. 1979;132:307–322. - PubMed

Publication types

MeSH terms

Substances

LinkOut - more resources