. 2010 Oct;28(10):1741-50.
doi: 10.1002/stem.504.

High-efficiency induction of neural conversion in human ESCs and human induced pluripotent stem cells with a single chemical inhibitor of transforming growth factor beta superfamily receptors

Affiliations

High-efficiency induction of neural conversion in human ESCs and human induced pluripotent stem cells with a single chemical inhibitor of transforming growth factor beta superfamily receptors

Jiaxi Zhou et al. Stem Cells. 2010 Oct.

Abstract

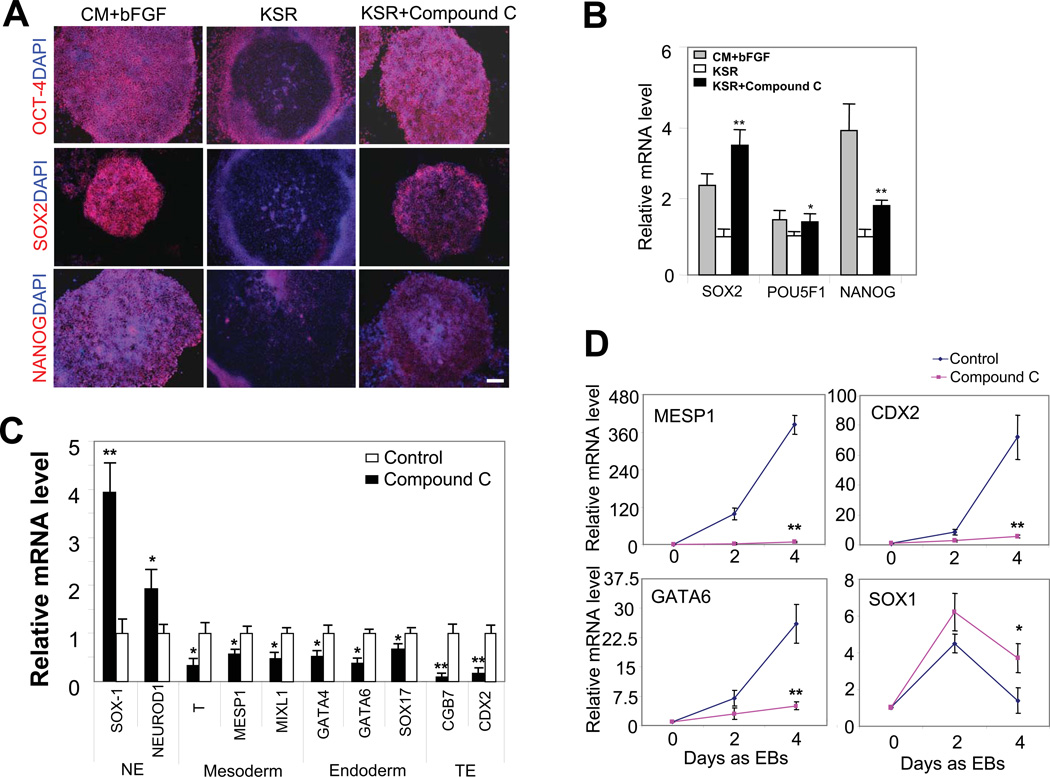
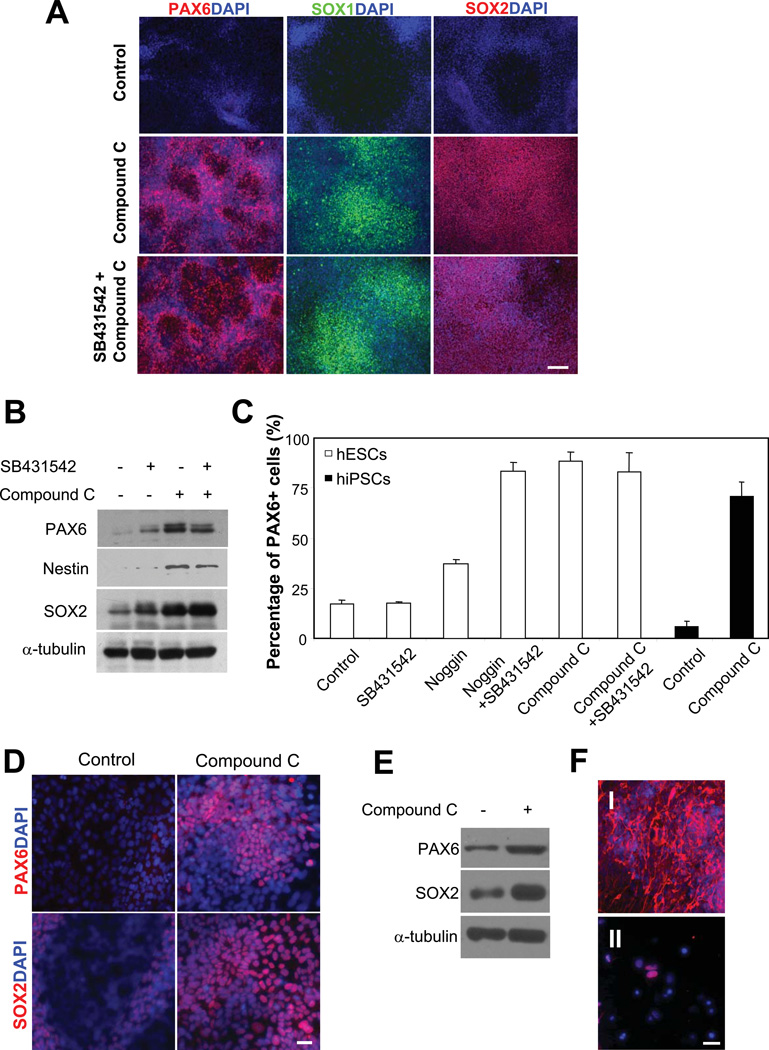
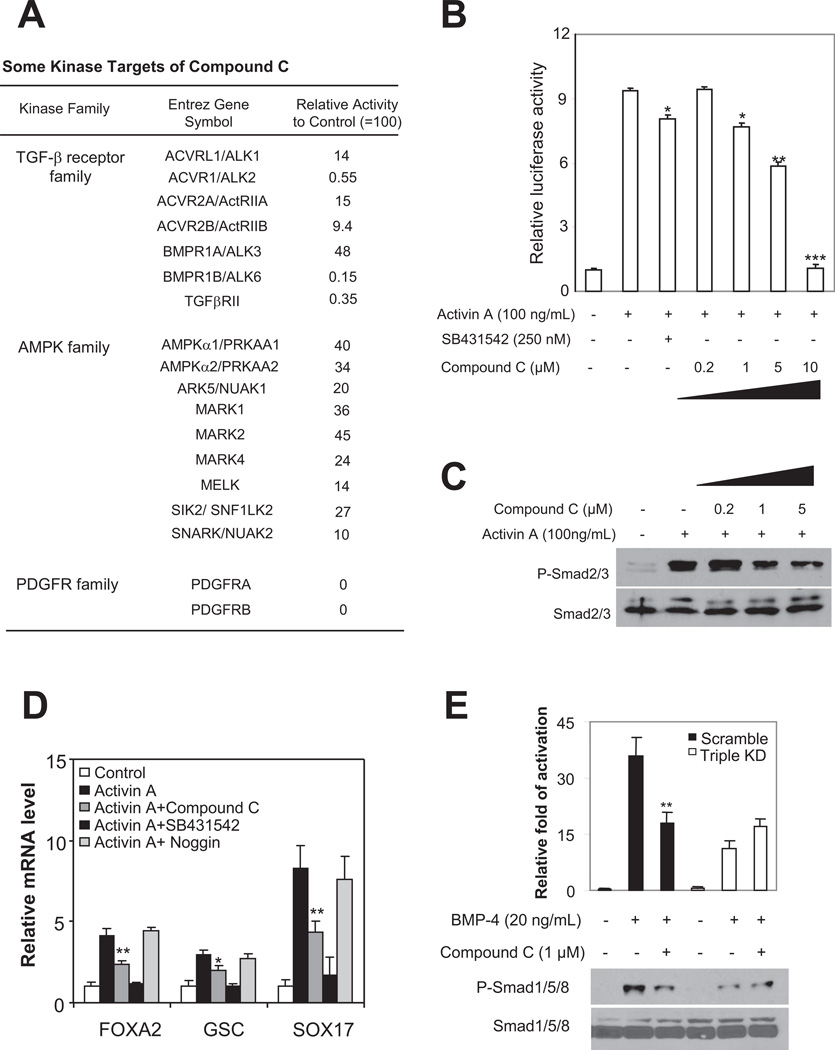
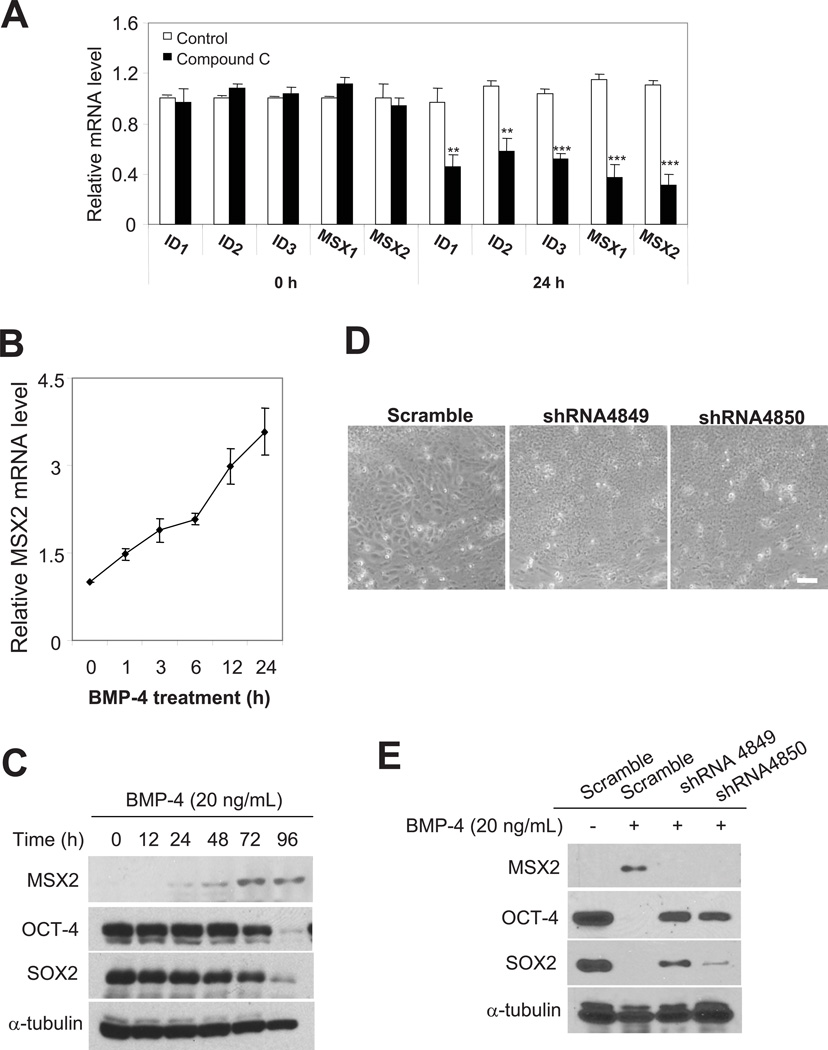
Chemical compounds have emerged as powerful tools for modulating ESC functions and deriving induced pluripotent stem cells (iPSCs), but documentation of compound-induced efficient directed differentiation in human ESCs (hESCs) and human iPSC (hiPSCs) is limited. By screening a collection of chemical compounds, we identified compound C (also denoted as dorsomorphin), a protein kinase inhibitor, as a potent regulator of hESC and hiPSC fate decisions. Compound C suppresses mesoderm, endoderm, and trophoectoderm differentiation and induces rapid and high-efficiency neural conversion in both hESCs and hiPSCs, 88.7% and 70.4%, respectively. Interestingly, compound C is ineffective in inducing neural conversion in mouse ESCs (mESCs). Large-scale kinase assay revealed that compound C targets at least seven transforming growth factor beta (TGF-β) superfamily receptors, including both type I and type II receptors, and thereby blocks both the Activin and bone morphogenesis protein (BMP) signaling pathways in hESCs. Dual inhibition of Activin and BMP signaling accounts for the effects of compound C on hESC differentiation and neural conversion. We also identified muscle segment homeobox gene 2 (MSX2) as a downstream target gene of compound C and a key signaling intermediate of the BMP pathway in hESCs. Our findings provide a single-step cost-effective method for efficient derivation of neural progenitor cells in adherent culture from human pluripotent stem cells. Therefore, it will be uniquely suitable for the production of neural progenitor cells in large scale and should facilitate the use of stem cells in drug screening and regenerative medicine and study of early human neural development.


Conflict of interest statement

DISCLOSURE OF POTENTIAL CONFLICTS OF INTEREST

The authors indicate no potential conflicts of interest.

Figures

Figure 1
Figure 1. Compound C suppresses mesoderm, endoderm and trophoectoderm differentiation in hESCs
(A) Immunofluorescence studies of OCT-4, SOX2 and NANOG proteins (red) in H1 cell colonies cultured in complete growth medium (CM + bFGF), medium with KSR only, and medium with KSR and 1 µM compound C for 6 d. All three pluripotency markers were expressed in 92.5%±4.7% of the colonies (i.e., with CM and bFGF). Removal of CM and bFGF reduced the OCT-4-, SOX2- and NANOG-positive colonies to 8.1%±3.2%, and addition of compound C increased it to 88.4%±6.5%. Nuclei were stained with DAPI (blue). H9 cells showed similar response to compound C treatment. Dose-dependent experiments with compound C (100 nM, 200 nM, 500 nM, 1 µM and 2 µM) showed that 1 µM was necessary to give rise to the strong anti-differentiation effect. Scale bar, 200 μm. (B) mRNA levels of SOX2, POU5F1 and NANOG in H1 hESCs cultured in aforementioned three conditions for 6 d, assessed by real-time PCR. All values were normalized to the level (=1) of mRNA in the cells treated with KSR alone. *, p<0.05; **, p<0.01. Cells treated with compound C were compared to control cells (i.e., with KSR only) treated with vehicle. ACTB (β-actin gene) was used as an internal control. (C) mRNA levels of differentiation markers in H1 hESCs cultured in medium with KSR only and medium with KSR and 1 µM compound C for 6 d, assessed by real-time PCR. All values were normalized to the level (=1) of mRNA in the cells treated with KSR alone. *, p<0.01; **, p<0.001. Cells treated with compound C were compared to control cells treated with vehicle. NE and TE denote neuroectoderm and trophoectoderm, respectively. (D) mRNA levels of control EBs or compound C-treated EBs assessed by real-time PCR. Four separate experiments were conducted, and quantification of three replicates of a typical experiment 30 is shown. Each bar represents the mean ± SEM (error bars). All values were normalized to the mRNA level (=1) of in the control cells on day 0. *, p<0.05; **, p<0.01. EBs treated with compound C were compared to control EBs on day 4.
Figure 2
Figure 2. Compound C induces high-efficiency neural conversion
(A) Immunofluorescence studies of PAX6 (left panel, red) and SOX1, (middle panel, green) and SOX2 (right panel, red) in differentiating H1 hESCs. Cell nuclei were stained with DAPI (blue). In contrast to control cells, which exhibited minimal anti-PAX6 fluorescence, H1 cells treated with compound C alone (1 μM) or with compound C (1 µM) and SB431542 (50 nM) combined expressed high level of PAX6 after 7-d differentiation. SOX1 and SOX2 were also highly expressed in compound C or compound C and SB431542 treated cells. Bar, 200 µm. (B) Western blot analysis of PAX6, Nestin and SOX2 in H1 cells with three treatments. Cells were induced to differentiate for 7 d. A typical experiment from five separate experiments is shown. α-tubulin was a loading control. (C) The percentage of PAX6+ cells assessed by flow cytometry. H1 hESCs treated with compound C alone or with compound C and SB431542 contained 88.7±2.5% and 80.3±10.3% (mean ± SEM) PAX6+ cells, respectively. In contrast, control cells and cells treated with SB431542 showed 16.9±1.9% and 17.7±0.4% PAX6 + cells. Treatment with Noggin (500 ng/mL) alone or combined with SB431542 gave rise to 36.9±1.6% and 84.7±3.9% PAX6+ cells, respectively. Similarly, compound C treatment of IMR-90-derived hiPSCs induced a high population of PAX6+ cells (70.3%±5.5%), in contrast to untreated cells (4.8%±2.1%). (D) Immunofluorescence studies of PAX6 (top panel, red) and SOX2 (bottom panel, red) in differentiating hiPSCs. Cell nuclei were stained with DAPI (blue). Cells were treated or not treated with 1 µM compound C for 7 d. scale bar, 50 μm. (E) Western blot analysis of PAX6 and SOX2 in hiPSCs treated or not treated with 1 µM compound C. Cells were induced to differentiate for 7 d. α-tubulin was a loading control. (F) Immunofluorescence studies of TUJ1 and NURR1 in terminally differentiated H1 hESCs. Anti-TUJ1 (I) and NURR1 (II) fluorescence (red) was observed in H1-derived differentiated cells after 2-w neural maturation. Nuclei were stained with DAPI (blue). Scale bar, 50 μm.
Figure 3
Figure 3. Compound C targets the TGF-β superfamily receptors and blocks Activin and BMP signaling
(A) Some of the kinases inhibited by 1 μM compound C and the degree of inhibition, as revealed by the in vitro kinase assay. The complete list of kinases examined is shown in Supplementary Table S2. (B) Relative luciferase activity of the pARE-GL3 reporter in H1 cells with or without Activin A (100 ng/mL, 24 h), treated with different concentrations of SB421542 or compound C. Results from four separate experiments are shown as mean±SEM. *, p<0.05 ; **, P<0.01; ***, p<0.001. Cells with various treatments were compared to control (with Activin stimulation). Hint amount of Rellina plasmid was co-transfected as an internal control. (C) Western blot analysis of phosphorylated Smad2/3 and total Smad2/3 in the nuclear fraction of H1 cells treated with various concentrations of compound C and stimulated with Activin-A (100 ng/mL) for 24 h. A typical experiment from four separate experiments is shown. Total Smad2/3 was a loading control. Compound C (1 µM) reduced the nuclear p-Smad2/3 levels by approximately 25%. (D) mRNA levels of endoderm markers SOX17, FOXA2 and GSC in H1 cells with various treatments, assessed by real-time PCR. Cells were stimulated with Activin A (100 ng/mL) for 5 d. Four separate experiments were conducted, and quantification of three replicates of a typical experiment is shown. Each bar represents the mean ± SEM (error bars). All values were normalized to the mRNA level (=1) of in the control cells. Activin and compound C treatments vs Activin alone were compared (*, p<0.05; **, p<0.01). (E) Western blot analysis of Smad1/5/8 phosphorylation under various conditions. Similar to 1 µM compound C treatment, depletions of ALK2, ALK3 and ALK6 altogether (denoted as Triple KD) attenuated the phosphorylation of Smad1/5/8 induced by BMP-4 (20 ng/mL, 30 min). Further addition of 1 µM compound C to cells lacking the three receptors exerted no detectable effects. A typical blot is shown in the bottom panel, and quantification of blots from four separate experiments is shown in the top panel. α-tubulin was a loading control. Y-axis represents relative intensities (measured with Image J) with values normalized to the signal (=100%) without BMP-4 or compound C treatment. Each bar represents mean ± SEM (error bars). Student t tests compared data between cells treated with compound C vs control cells after BMP-4 addition (**, p<0.01).
Figure 4
Figure 4. MSX2 as a target gene of compound C and a key intermediate of the BMP pathway
(A) mRNA levels of ID1, ID2, ID3, MSX1 and MSX2 in H1 hESCs induced to differentiate by the removal of bFGF and CM, with or without the treatment of 1 µM compound C, assessed by real-time PCR. Four separate experiments were conducted, and quantification of four replicates of a typical experiment is shown. Bars represent mean ± SEM (error bars). All values were normalized to the mRNA level in the control cells at 0 h. Cells treated with compound C were compared to control cells treated with vehicle. **, p<0.01; ***, p<0.001. (B) The mRNA level of MSX2 in H1 hESCs after BMP-4 treatment (20 ng/mL) for various time points assessed by real-time PCR. (C) Western blot analysis of MSX2, OCT-4 and SOX2 in H1 cells after BMP-4 treatment (20 ng/mL) for various time points. (D) Phase-contrast images of H1 cells with MSX2 depletion 4 d after BMP-4 treatment (20 ng/mL). Two separate shRNAs were used to verify the effects of MSX2 depletion, while scramble shRNA was used as a control. Scale bar, 50 μm. (E) Western blot analysis of MSX2, OCT-4 and SOX2 in H1 cells with MSX2 depletion 4 d after BMP-4 treatment (20 ng/mL). Two separate shRNAs (sh4849 and sh4850) were used to verify the effects of MSX2 depletion. α-tubulin was used as loading controls for (C) and (E).

Similar articles

Cited by

References

    1. Thomson JA, Itskovitz-Eldor J, Shapiro SS, et al. Embryonic stem cell lines derived from human blastocysts. Science. 1998;282:1145–1147. - PubMed
    1. Yamanaka S. A fresh look at iPS cells. Cell. 2009;137:13–17. - PubMed
    1. Levenstein ME, Ludwig TE, Xu RH, et al. Basic fibroblast growth factor support of human embryonic stem cell self-renewal. Stem Cells. 2006;24:568–574. - PMC - PubMed
    1. Vallier L, Alexander M, Pedersen RA. Activin/Nodal and FGF pathways cooperate to maintain pluripotency of human embryonic stem cells. J Cell Sci. 2005;118:4495–4509. - PubMed
    1. Xu RH, Sampsell-Barron TL, Gu F, et al. NANOG is a direct target of TGFbeta/activin-mediated SMAD signaling in human ESCs. Cell Stem Cell. 2008;3:196–206. - PMC - PubMed

Publication types

MeSH terms