Precise, facile initial rate measurements
- PMID: 20735055
- PMCID: PMC3245625
- DOI: 10.1021/jp1055528
Precise, facile initial rate measurements
Abstract
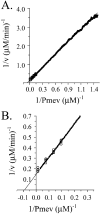
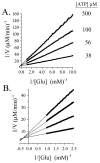
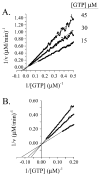
Progress curve analysis has been used sparingly in studies of enzyme-catalyzed reactions due largely to the complexity of the integrated rate expressions used in data analysis. Using an experimental design that simplifies the analysis, the advantages and limitations of progress curve experiments are explored in a study of four different enzyme-catalyzed reactions. The approach involves relatively simple protocols, requires 20-25% of the materials, and provides 10- to 20-fold signal enhancements compared to analogous initial rate studies. Product inhibition, which complicates integrated rate analysis, was circumvented using cloned, purified enzymes that remove the products and draw the reaction forward. The resulting progress curves can be transformed into the equivalent of thousands of initial rate and [S] measurements and, due to the absence of product inhibition, are plotted in the familiar, linear double-reciprocal format. Allowing product to accumulate during a reaction produces a continuously changing substrate/product ratio that can be used as the basis for obtaining product inhibition constants and to distinguish among the three classical inhibition mechanisms. Algebraic models describing the double-reciprocal patterns obtained from such inhibition studies are presented. The virtual continuum of substrate concentrations that occurs during a progress curve experiment provides a nearly errorless set of relative concentrations that results in remarkably precise data; kinetic constant standard deviations are on the order of 0.5%.
Figures


Similar articles
-
Experimental designs for estimating the parameters of the Michaelis-Menten equation from progress curves of enzyme-catalyzed reactions.Biochim Biophys Acta. 1991 Nov 15;1080(3):231-6. doi: 10.1016/0167-4838(91)90007-m. Biochim Biophys Acta. 1991. PMID: 1954231
-
Kinetics of enzymes subject to very strong product inhibition: analysis using simplified integrated rate equations and average velocities.J Theor Biol. 1983 Feb 21;100(4):597-611. doi: 10.1016/0022-5193(83)90325-9. J Theor Biol. 1983. PMID: 6876816
-
The determination of specificity constants in enzyme-catalysed reactions.Biochem J. 1986 Oct 1;239(1):221-4. doi: 10.1042/bj2390221. Biochem J. 1986. PMID: 3800980 Free PMC article.
-
Applications of Monte Carlo Simulation in Modelling of Biochemical Processes.In: Mode CJ, editor. Applications of Monte Carlo Methods in Biology, Medicine and Other Fields of Science [Internet]. Rijeka (HR): InTech; 2011 Feb 28. Chapter 4. In: Mode CJ, editor. Applications of Monte Carlo Methods in Biology, Medicine and Other Fields of Science [Internet]. Rijeka (HR): InTech; 2011 Feb 28. Chapter 4. PMID: 28045483 Free Books & Documents. Review.
-
Affinity labeling and related approaches to targeting specific enzyme sites.Subcell Biochem. 1995;24:177-205. doi: 10.1007/978-1-4899-1727-0_7. Subcell Biochem. 1995. PMID: 7900176 Review. No abstract available.
Cited by
-
Allosteres to regulate neurotransmitter sulfonation.J Biol Chem. 2019 Feb 15;294(7):2293-2301. doi: 10.1074/jbc.RA118.006511. Epub 2018 Dec 13. J Biol Chem. 2019. PMID: 30545938 Free PMC article.
-
High accuracy in silico sulfotransferase models.J Biol Chem. 2013 Nov 29;288(48):34494-501. doi: 10.1074/jbc.M113.510974. Epub 2013 Oct 15. J Biol Chem. 2013. PMID: 24129576 Free PMC article.
-
Equivalent dose methodology for activity-based comparisons of protease performance during byproduct protein hydrolysis.Food Chem X. 2025 May 28;28:102596. doi: 10.1016/j.fochx.2025.102596. eCollection 2025 May. Food Chem X. 2025. PMID: 40520692 Free PMC article.
References
Publication types
MeSH terms
Substances
Grants and funding
LinkOut - more resources
Full Text Sources
Other Literature Sources

