. 2010 Dec;161(8):1817-34.
doi: 10.1111/j.1476-5381.2010.01006.x.

Structural determinants in the second intracellular loop of the human cannabinoid CB1 receptor mediate selective coupling to G(s) and G(i)

Affiliations

Structural determinants in the second intracellular loop of the human cannabinoid CB1 receptor mediate selective coupling to G(s) and G(i)

X P Chen et al. Br J Pharmacol. 2010 Dec.

Abstract

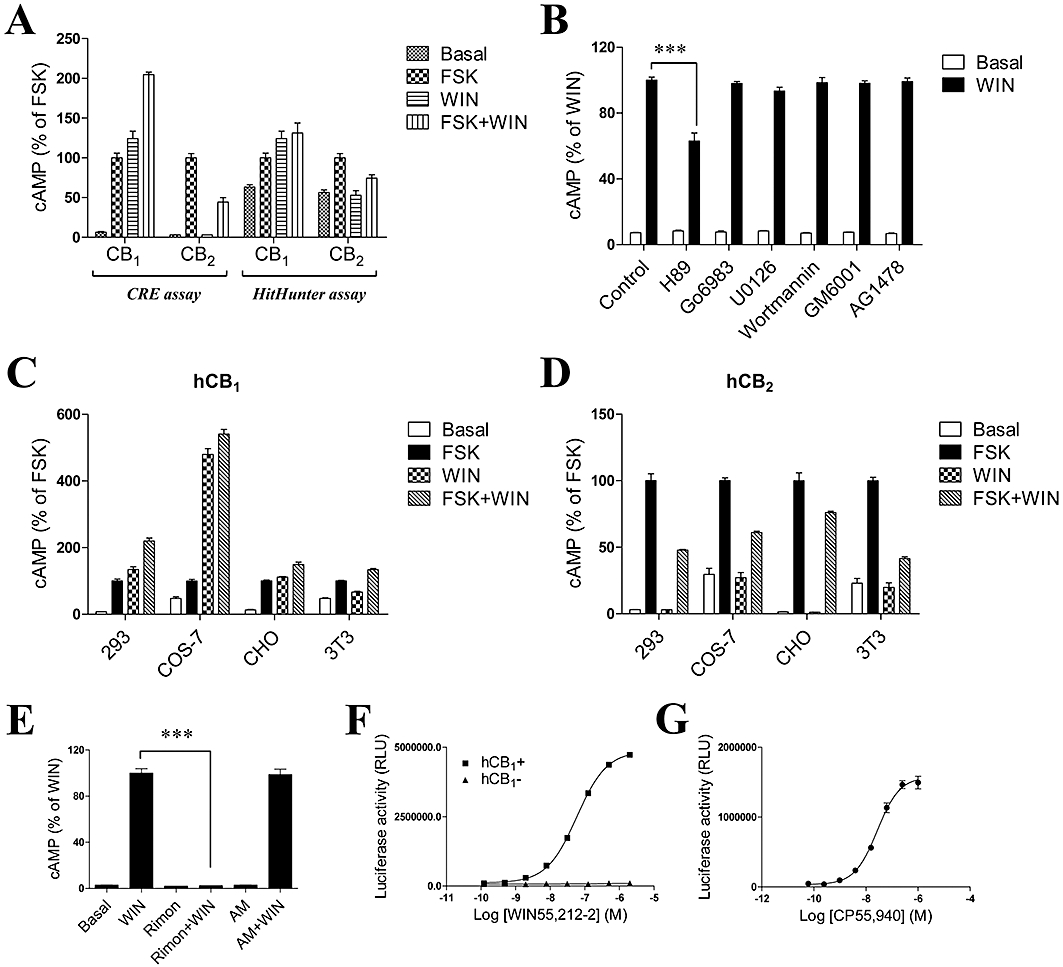
Background and purpose: The cannabinoid CB(1) receptor is primarily thought to be functionally coupled to the G(i) form of G proteins, through which it negatively regulates cAMP accumulation. Here, we investigated the dual coupling properties of CB(1) receptors and characterized the structural determinants that mediate selective coupling to G(s) and G(i).

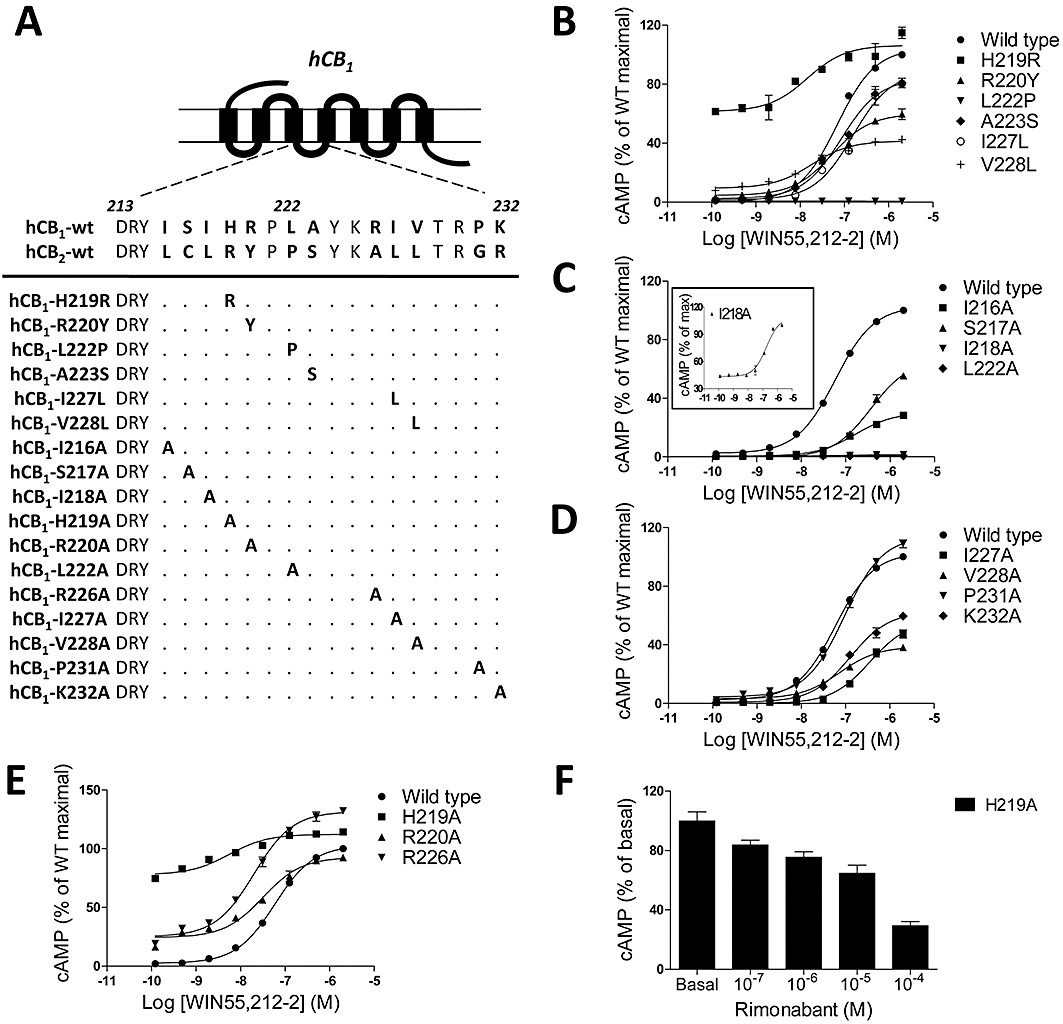
Experimental approach: A cAMP-response element reporter gene system was employed to quantitatively analyze cAMP change. CB(1)/CB(2) receptor chimeras and site-directed mutagenesis combined with functional assays and computer modelling were used to determine the structural determinants mediating selective coupling to G(s) and G(i).

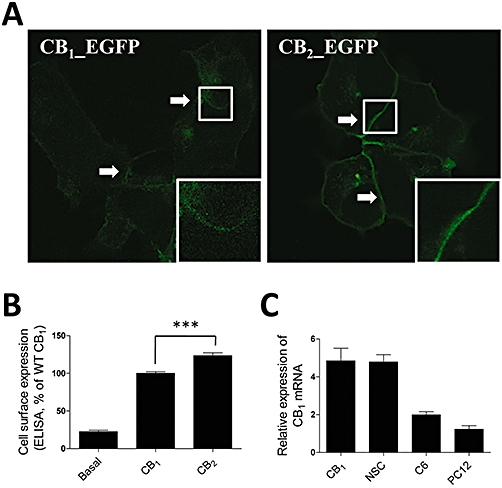
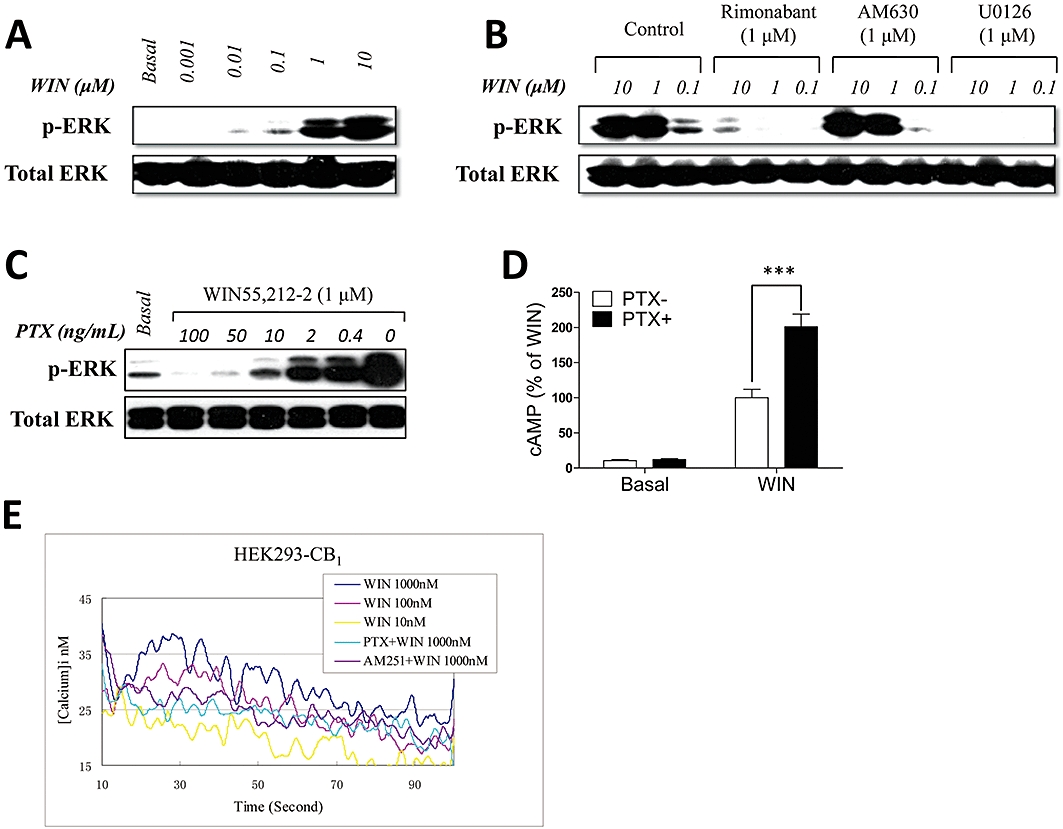
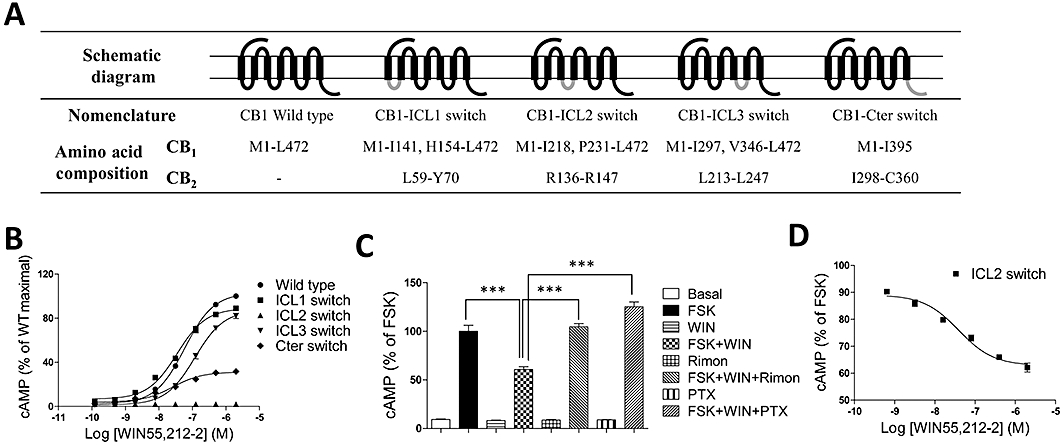
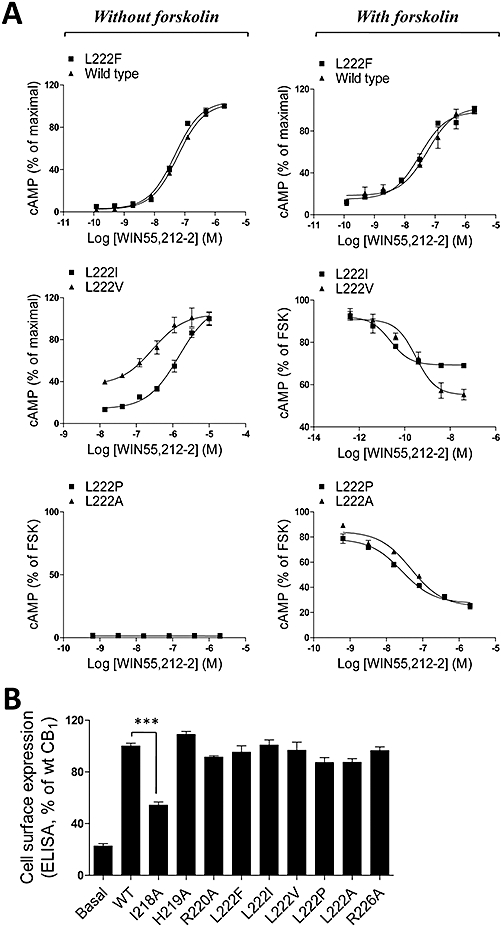
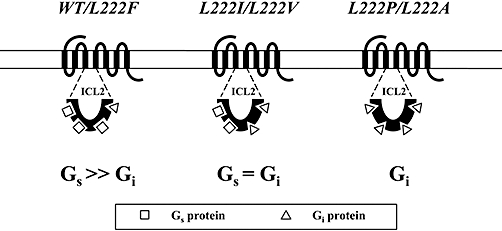
Key results: CB(1) receptors could couple to both G(s)-mediated cAMP accumulation and G(i)-induced activation of ERK1/2 and Ca(2+) mobilization, whereas CB(2) receptors selectively coupled to G(i) and inhibited cAMP production. Using CB(1)/CB(2) chimeric receptors, the second intracellular loop (ICL2) of the CB(1) receptor was identified as primarily responsible for mediating G(s) and G(i) coupling specificity. Furthermore, mutation of Leu-222 in ICL2 to either Ala or Pro switched G protein coupling from G(s) to G(i), while to Ile or Val led to balanced coupling of the mutant receptor with G(s) and G(i) .

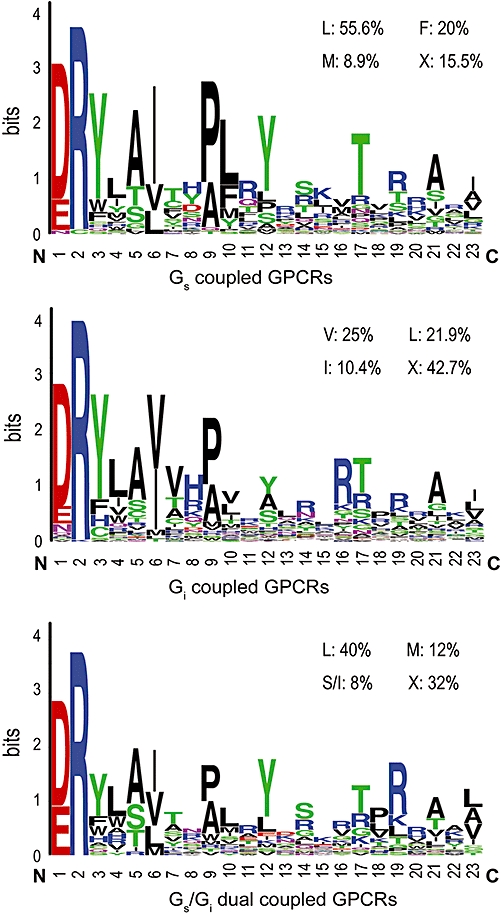
Conclusions and implications: The ICL2 of CB(1) receptors and in particular Leu-222, which resides within a highly conserved DRY(X)(5) PL motif, played a critical role in G(s) and G(i) protein coupling and specificity. Our studies provide new insight into the mechanisms governing the coupling of CB(1) receptors to G proteins and cannabinoid-induced tolerance.


Figures

Figure 1
Figure 1
Agonist-induced activation of adenylyl cyclase in cells expressing the human CB1 receptor. (A) Characterization of cAMP signaling using CRE-luciferase assay and HitHunter cAMP assay. HEK293 cells stably transfected with Flag-CB1 or Flag-CB2 receptors were stimulated with 1 µM WIN55,212-2 in the absence or presence of 10 µM forskolin (FSK). cAMP measurements were carried out as described in the Methods section. (B) Effects of protein kinase inhibitors on inhibition of adenylate cyclase activity induced by WIN55,212-2. HEK293 cells stably expressing CB1 receptors were pretreated with inhibitors for 1 h and stimulated with 1 µM WIN55,212-2 for 4 h. (C,D) cAMP assay of CB1 and CB2 receptors in different cell lines. Different cell lines were transiently transfected with CB1 or CB2 receptor expression constructs and functional assays were carried out as described in the Methods section. (E) WIN55,212-2 induced cAMP accumulation was completely blocked by the CB1 receptor-specific inverse agonist rimonabant (Rimon). Cells were treated with either vehicle or 1 µM WIN55,212-2 alone, or pretreated with 1 µM Rimon and AM630 followed by application of 1 µM WIN55,212-2 in the presence of 1 µM Rimon and AM630. (F,G) Dose-dependent curve of WIN55,212-2 or CP55,940-induced cAMP levels. Cells were incubated with various concentrations of WIN55,212-2 or CP55,940 for 4 h. Results (mean ± SEM) are representative of three independent experiments, each performed in triplicate. ***P < 0.001.
Figure 2
Figure 2
Expression of CB1 and CB2 receptors. (A) Confocal microscopy analysis of CB1 and CB2 receptor expression. HEK293 cells were transiently transfected with EGFP-fused receptors and the cell surface expression was analysed by confocal microscopy. Insets have been sequentially magnified ×2. The cells shown are representative of the cell populations and performed at least three times. (B) ELISA analysis of CB1 and CB2 receptor expression. HEK293 cells were transiently transfected with Flag epitope-tagged receptors and the cell surface expression was measured by ELISA analysis. The results represent the mean ± SEM of three independent experiments, each done in triplicate. ***P < 0.01. (C) Expression of CB1 receptor mRNA in cells with endogenous expression and in recombinant cell lines. Quantitative real-time PCR detection of CB1 receptor mRNA was normalized to that of β-actin within each sample, and expressed as a fold difference relative to the PC12 cell line. The error bars displayed are the standard error of duplicate readings from at least three independent experiments. WT, wild type.
Figure 3
Figure 3
The CB1 receptor is dually coupled to Gs and Gi. (A) For dose-response experiments, serum-starved cells were treated with different concentrations of WIN 55,212-2 as indicated and harvested after 5 min. (B) Inhibition of WIN55,212-2-stimulated ERK phosphorylation by rimonabant. Serum-starved cells were incubated for 15 min with 1 µM rimonabant and AM630 and stimulated for 5 min with 1 µM WIN55,212-2 in the presence of rimonabant and AM630. U0126 (1 µM) was used as a negative control. (C) Inhibition of ERK phosphorylation was observed in cells pretreated with increasing concentration of Pertussis toxin (PTX) and stimulated with 1 µM WIN55,212-2. The results shown (A–C) are representative of one of three independent experiments with similar results. (D) PTX unmasked the Gi-coupling of the CB1 receptor in the cAMP assay. Transiently transfected HEK293 cells were pretreated with or without 100 ng·mL−1 PTX for 12 h and stimulated with 1 µM WIN55,212-2. The data (D) are representative of at least three separate experiments performed in triplicate, and mean ± SEM are shown. ***P < 0.001. (E) Specific block of intracellular Ca2+ influx in HEK293 cells by PTX and AM251. Ca2+ influx in cells stably expressing CB1 and pretreated with 100 ng·ml−1 PTX or with 1 µM AM251 was measured in response to 1 µM WIN55,212-2 using the fluorescent Ca2+ indicator fura-2. The data shown in (E) are representative of more than four separate experiments performed in triplicate.
Figure 4
Figure 4
Effects of key domains in the CB1 receptor on Gs- and Gi-dependent signalling. (A) Composition of cannabinoid receptor chimeras. The overall composition of individual cannabinoid receptor chimeras is shown schematically. Numbers indicate the amino acid residues corresponding to the parental cannabinoid receptors. The CB1 receptor sequence is shown in black, and the CB2 receptor sequence is in dark grey. (B) Dose-response curve of cAMP accumulation for the CB1 chimeric receptors upon WIN55,212-2 stimulation. For cAMP measurements, cells were incubated 48 h after transfection with various concentrations of WIN55,212-2. (C) Effects of Pertussis toxin (PTX) and rimonabant (Rimon) on cAMP accumulation in HEK 293 cells expressing CB1-ICL2 receptors. Cells were seeded 24 h prior to the addition of toxins and antagonist. PTX (100 ng·mL−1) and Rimon (1 µM) were added to the cells in FBS-free medium and incubated for 12 h and 15 min respectively. Cells were then incubated with 10 µM forskolin (FSK) or 1 µM WIN55,212-2 plus 10 µM FSK for 4 h. (D) Dose-response curve of inhibition of FSK-induced cAMP elevation, mediated by CB1-ICL2 receptors. Cells were incubated with 10 µM FSK or 10 µM FSK plus WIN55,212-2 (various concentrations) for 4 h. Data shown in (B) and (C, D) are expressed as the percent cAMP activity over the maximal response of wild-type (WT) CB1 receptors and the percent cAMP activity over FSK respectively. Data shown in (B–D) are expressed as the mean ± SEM for triplicate experiments performed in triplicate. ***P < 0.001. ICL, intracellular loop.
Figure 5
Figure 5
Effects of key residues in the second intracellular loop (ICL2) of the CB1 receptor on Gs-dependent signalling. (A) Single amino acid CB1 mutations within the ICL2. (B–E) Cells were incubated with various concentrations of WIN55,212-2 for 4 h. Values are expressed as a percentage of WIN55,212-2 maximal stimulation in wild-type (WT) CB1 receptors. The results for the mutant I218A is presented in detail in the inset in panel (C), the values of which are expressed as the percent over its maximal. (F) Effect of rimonabant on basal levels of cAMP in H219A mutant transiently transfected cells. Cells were exposed to increasing concentration of rimonabant for 4 h at 37°C. Data points are shown as the mean ± SEM and are representative of at least three independent experiments, each carried out in triplicate.
Figure 6
Figure 6
(A) Effects of key residues within a highly conserved G protein-coupled receptor motif in selective G protein coupling. Cells were seeded overnight and then incubated with WIN55,212-2 (various concentrations) in the presence or absence of forskolin (FSK; 10 µM) for 4 h. Data (mean ± SEM) are representative of at least three separate experiments performed in triplicate. (B) ELISA analysis of expression of wild-type and mutant receptors. HEK293 cells were transiently transfected with Flag epitope-tagged receptors and the cell surface expression was measured by ELISA analysis. The results represent the mean ± SEM of three independent experiments, each carried out in triplicate. ***P < 0.001.
Figure 7
Figure 7
Amino acid frequency of the second intracellular loop (ICL2) in the CB1 receptor. Amino acid frequency of ICL2 in G protein-coupled receptors (GPCRs) generated from analysis of the composition of the ICL2 of 96 Gi, 45 Gs and 27 Gi/Gs dual coupled receptors. Frequency of occurrence at position CB1-L222 for Gs, Gi and Gs/Gi dual coupled GPCRs is indicated in the upper right corner in each panel.
Figure 8
Figure 8
Schematic diagram of cannabinoid CB1 receptor-G protein coupling. Gs >>Gi represents the receptor predominantly coupling to Gs; Gs= Gi represents the receptor balanced coupling to Gs and Gi; and Gi means the receptor only coupling to Gi.

Similar articles

Cited by

References

    1. Abadji V, Lucas-Lenard JM, Chin C, Kendall DA. Involvement of the carboxyl terminus of the third intracellular loop of the cannabinoid CB1 receptor in constitutive activation of Gs. J Neurochem. 1999;72:2032–2038. - PubMed
    1. Adams IB, Martin BR. Cannabis: pharmacology and toxicology in animals and humans. Addiction. 1996;91:1585–1614. - PubMed
    1. Alexander SPH, Mathie A, Peters JA. Guide to Receptors and Channels (GRAC), 4th edn. Br J Pharmacol. 2009;158(Suppl 1):S1–S254. - PMC - PubMed
    1. Allgeier A, Laugwitz KL, Van Sande J, Schultz G, Dumont JE. Multiple G-protein coupling of the dog thyrotropin receptor. Mol Cell Endocrinol. 1997;127:81–90. - PubMed
    1. Anavi-Goffer S, Fleischer D, Hurst DP, Lynch DL, Barnett-Norris J, Shi S, et al. Helix 8 Leu in the CB1 cannabinoid receptor contributes to selective signal transduction mechanisms. J Biol Chem. 2007;282:25100–25113. - PubMed

Publication types

MeSH terms

Substances