

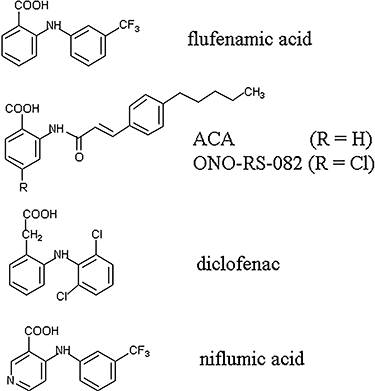
Induction of a novel cation current in cardiac ventricular myocytes by flufenamic acid and related drugs
- PMID: 20735425
- PMCID: PMC2989592
- DOI: 10.1111/j.1476-5381.2010.00901.x
Induction of a novel cation current in cardiac ventricular myocytes by flufenamic acid and related drugs
Abstract
Background and purpose: Interest in non-selective cation channels has increased recently following the discovery of transient receptor potential (TRP) proteins, which constitute many of these channels.
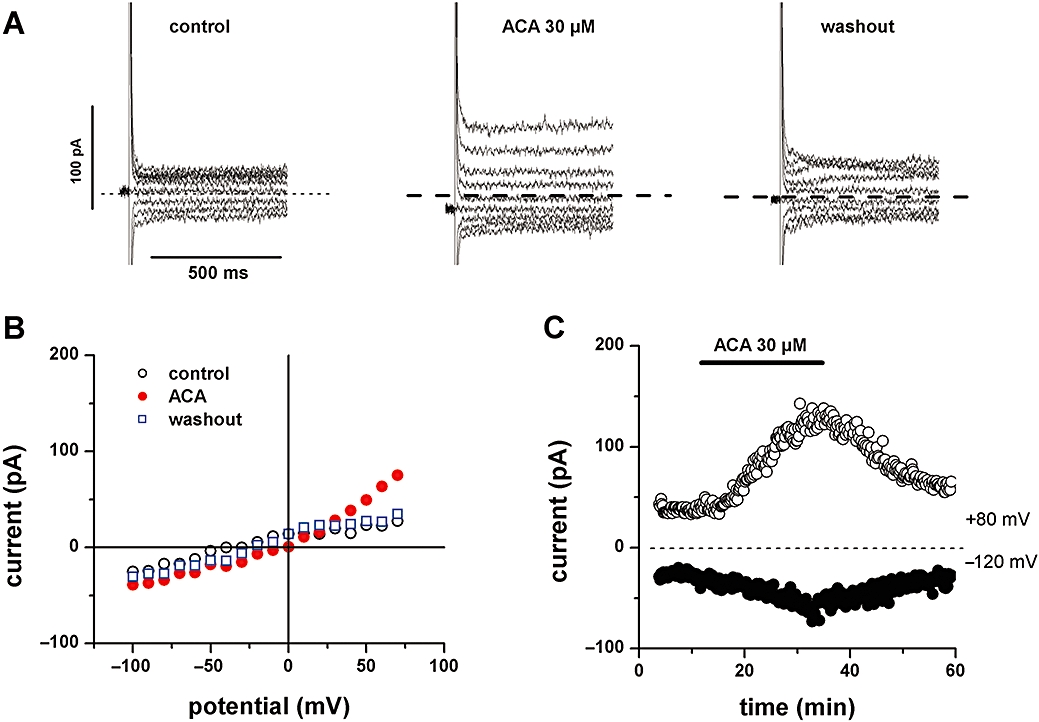
Experimental approach: We used the whole-cell patch-clamp technique on isolated ventricular myocytes to investigate the effect of flufenamic acid (FFA) and related drugs on membrane ion currents.
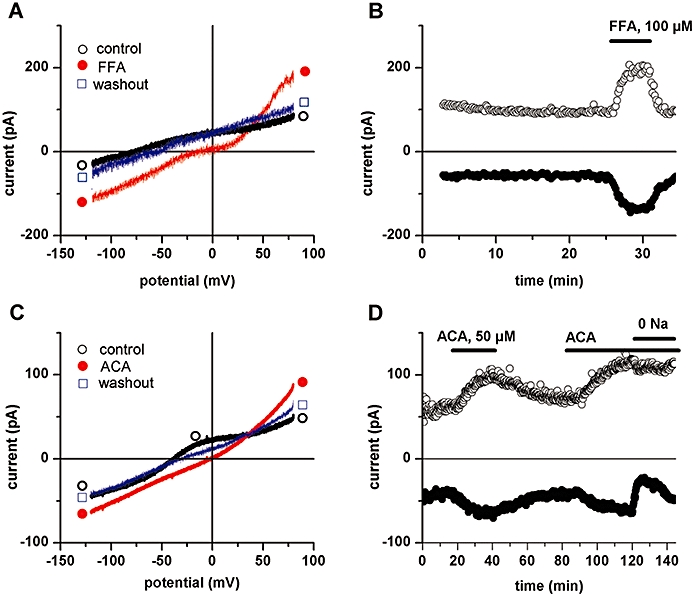
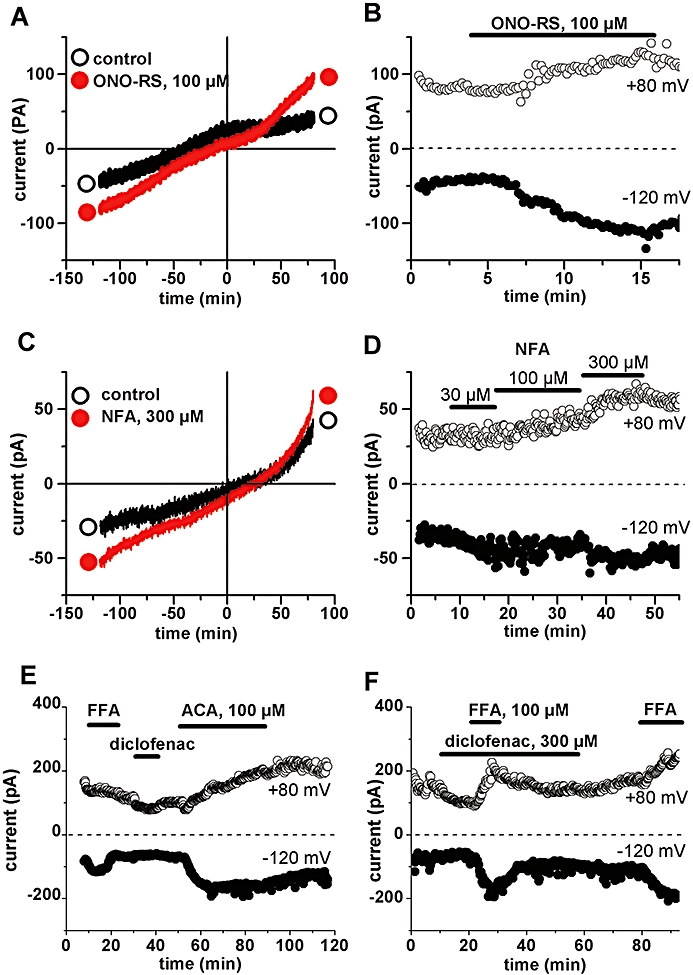
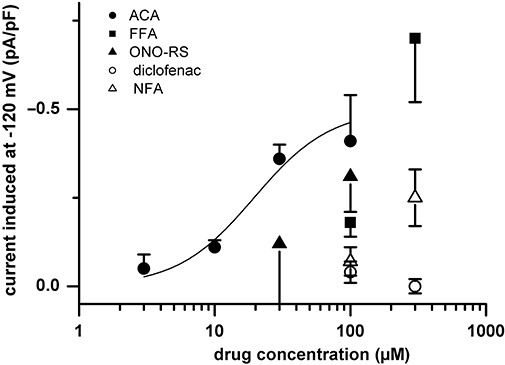
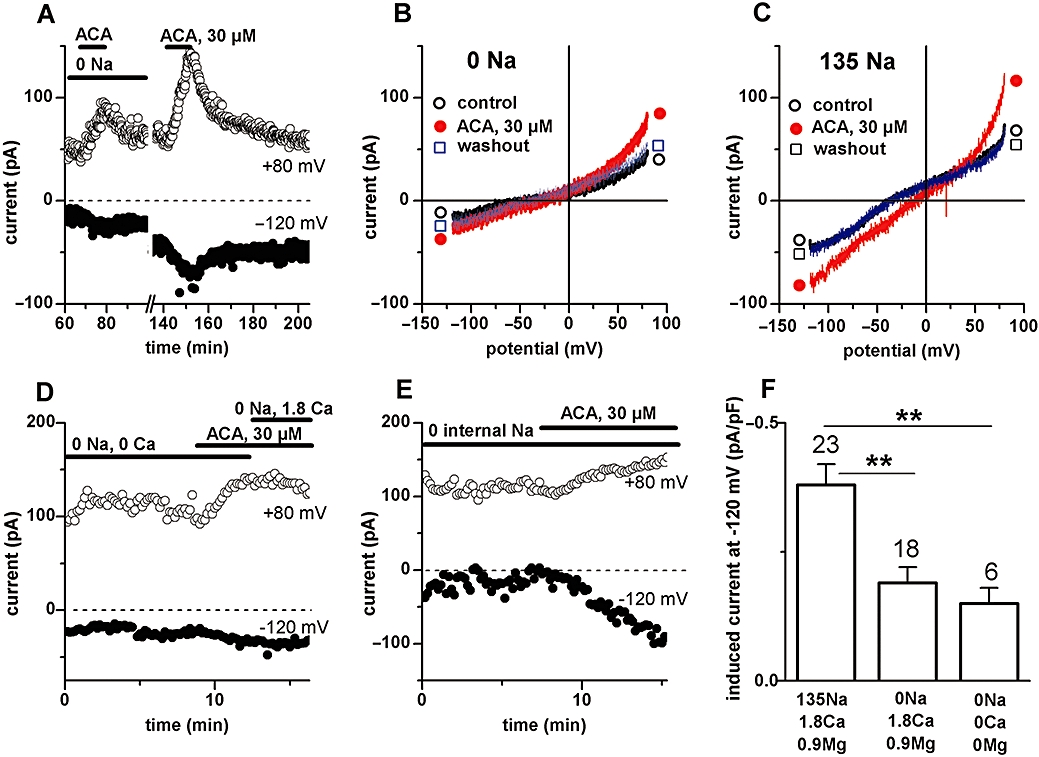
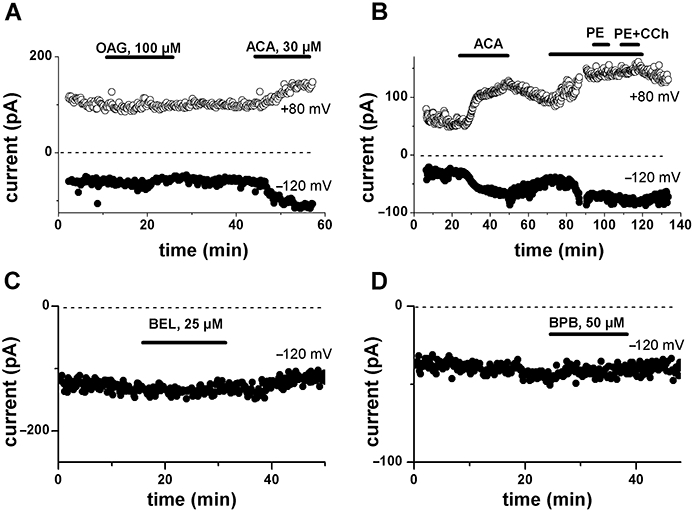
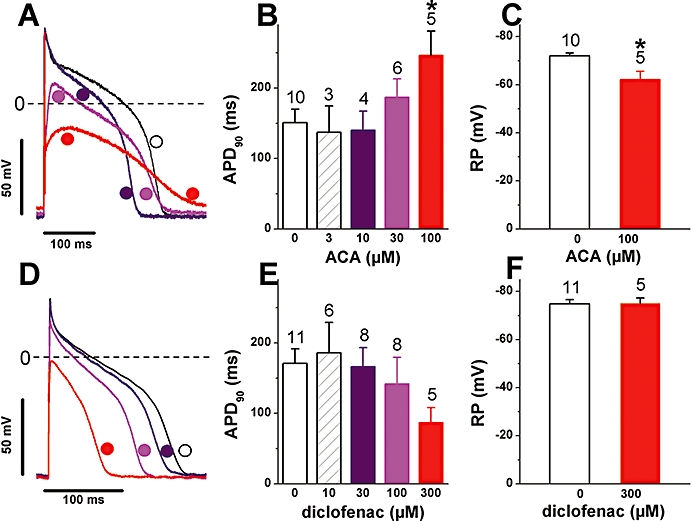
Key results: With voltage-dependent and other ion channels inhibited, cells that were exposed to FFA, N-(p-amylcinnamoyl)anthranilic acid (ACA), ONO-RS-082 or niflumic acid (NFA) responded with an increase in currents. The induced current reversed at +38 mV, was unaffected by lowering extracellular Cl(-) concentration or by the removal of extracellular Ca(2+) and Mg(2+), and its inward but not outward component was suppressed in Na(+)-free extracellular conditions. The current was suppressed by Gd(3+) but was resistant to 2-aminoethoxydiphenyl borate (2-APB) and to amiloride. It could not be induced by the structurally related non-fenamate anti-inflammatory drug diclofenac, nor by the phospholipase-A(2) inhibitors bromoenol lactone and bromophenacyl bromide. Muscarinic or alpha-adrenoceptor activation or application of diacylglycerol failed to induce or modulate the current.
Conclusions and implications: Flufenamic acid and related drugs activate a novel channel conductance, where Na(+) is likely to be the major charge carrier. The identity of the channel remains unclear, but it is unlikely to be due to Ca(2+)-activated (e.g. TRPM4/5), Mg(2+)-sensitive (e.g. TRPM7) or divalent cation-selective TRPs.
Figures
Similar articles
-
Flufenamic acid as an ion channel modulator.Pharmacol Ther. 2013 May;138(2):272-84. doi: 10.1016/j.pharmthera.2013.01.012. Epub 2013 Jan 25. Pharmacol Ther. 2013. PMID: 23356979 Free PMC article. Review.
-
Inhibition of the calcium-activated chloride current in cardiac ventricular myocytes by N-(p-amylcinnamoyl)anthranilic acid (ACA).Biochem Biophys Res Commun. 2010 Nov 19;402(3):531-6. doi: 10.1016/j.bbrc.2010.10.069. Epub 2010 Oct 28. Biochem Biophys Res Commun. 2010. PMID: 20971070
-
Comparison of the effects of fenamates on Ca-activated chloride and potassium currents in rabbit portal vein smooth muscle cells.Br J Pharmacol. 1995 Dec;116(7):2939-48. doi: 10.1111/j.1476-5381.1995.tb15948.x. Br J Pharmacol. 1995. PMID: 8680728 Free PMC article.
-
9-Phenanthrol and flufenamic acid inhibit calcium oscillations in HL-1 mouse cardiomyocytes.Cell Calcium. 2013 Sep;54(3):193-201. doi: 10.1016/j.ceca.2013.06.003. Epub 2013 Jul 5. Cell Calcium. 2013. PMID: 23831210 Free PMC article.
-
N-(p-amylcinnamoyl)anthranilic acid (ACA): a phospholipase A(2) inhibitor and TRP channel blocker.Cardiovasc Drug Rev. 2007 Spring;25(1):61-75. doi: 10.1111/j.1527-3466.2007.00005.x. Cardiovasc Drug Rev. 2007. PMID: 17445088 Review.
Cited by
-
Pharmacological comparison of novel synthetic fenamate analogues with econazole and 2-APB on the inhibition of TRPM2 channels.Br J Pharmacol. 2012 Nov;167(6):1232-43. doi: 10.1111/j.1476-5381.2012.02058.x. Br J Pharmacol. 2012. PMID: 22646516 Free PMC article.
-
Potential Drug Candidates to Treat TRPC6 Channel Deficiencies in the Pathophysiology of Alzheimer's Disease and Brain Ischemia.Cells. 2020 Oct 24;9(11):2351. doi: 10.3390/cells9112351. Cells. 2020. PMID: 33114455 Free PMC article. Review.
-
An activator of voltage-gated K+ channels Kv1.1 as a therapeutic candidate for episodic ataxia type 1.Proc Natl Acad Sci U S A. 2023 Aug;120(31):e2207978120. doi: 10.1073/pnas.2207978120. Epub 2023 Jul 24. Proc Natl Acad Sci U S A. 2023. PMID: 37487086 Free PMC article.
-
Flufenamic acid as an ion channel modulator.Pharmacol Ther. 2013 May;138(2):272-84. doi: 10.1016/j.pharmthera.2013.01.012. Epub 2013 Jan 25. Pharmacol Ther. 2013. PMID: 23356979 Free PMC article. Review.
-
Upregulated LRRC55 promotes BK channel activation and aggravates cell injury in podocytes.J Exp Med. 2021 Mar 1;218(3):e20192373. doi: 10.1084/jem.20192373. J Exp Med. 2021. PMID: 33346797 Free PMC article.
References
-
- Alvarez J, Coulombe A, Cazorla OF, Ugur M, Rauzier JM, Magyar J, et al. ATP/UTP activate cation-permeable channels with TRPC3/7 properties in rat cardiomyocytes. Am J Physiol Heart Circ Physiol. 2008;285:H21–H28. - PubMed
-
- Aly FA, Al-Tamimi SA, Alwarthan AA. Determination of flufenamic acid and mefenamic acid in pharmaceutical preparations and biological fluids using flow injection analysis with tris(2,2′-bipyridyl)ruthenium(II) chemiluminescence detection. Anal Chim Acta. 2000;416:87–96.
-
- Clapham DE. TRP channels as cellular sensors. Nature. 2003;426:517–524. - PubMed
Publication types
MeSH terms
Substances
LinkOut - more resources
Full Text Sources
Miscellaneous
