

Temporal anatomy of an epigenetic switch in cell programming: the white-opaque transition of C. albicans
- PMID: 20735781
- PMCID: PMC3057202
- DOI: 10.1111/j.1365-2958.2010.07331.x
Temporal anatomy of an epigenetic switch in cell programming: the white-opaque transition of C. albicans
Abstract
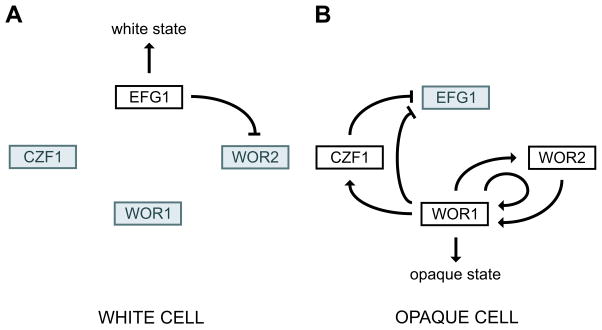
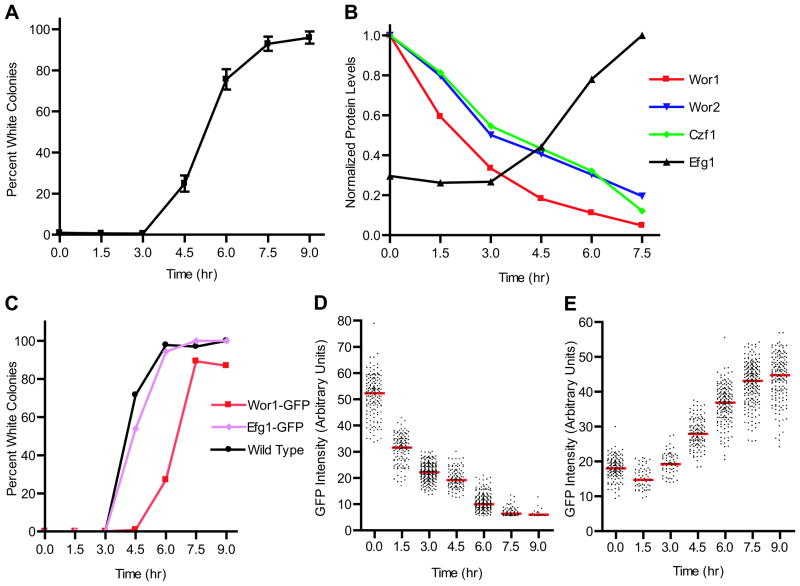
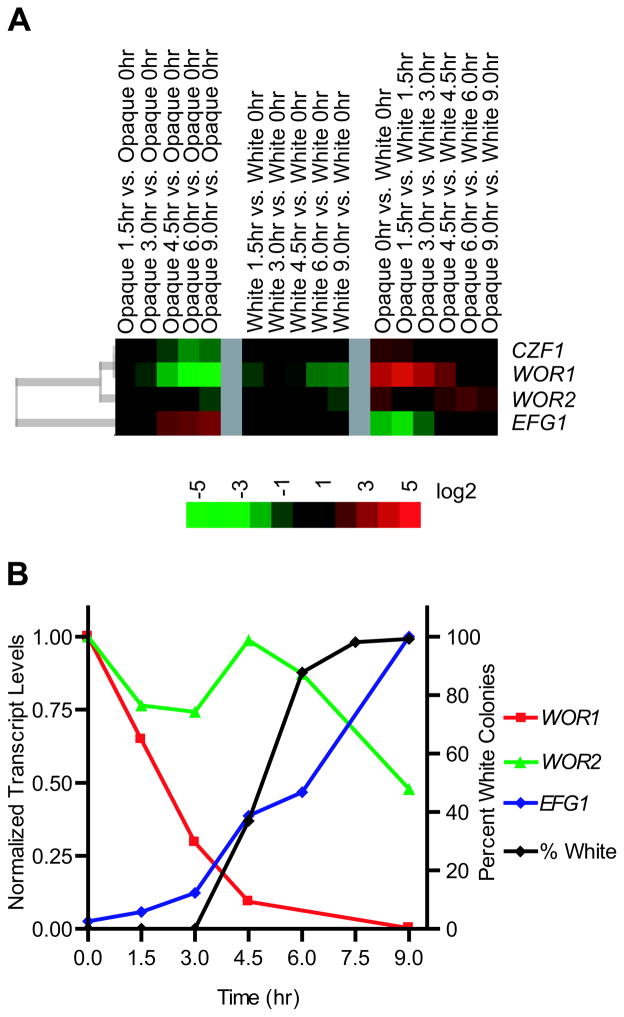
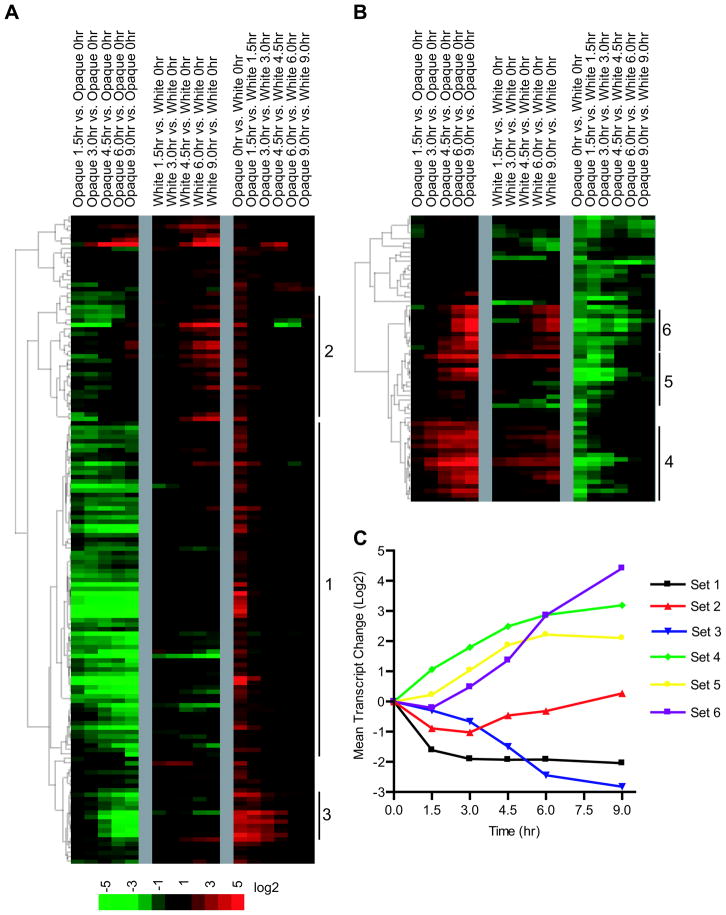
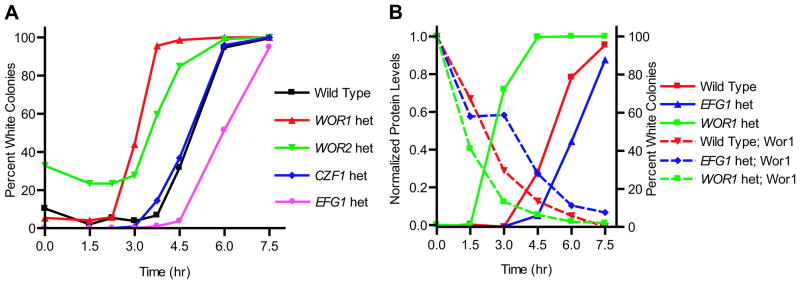
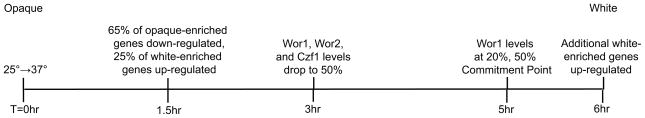
The human pathogen Candida albicans undergoes a well-defined switch between two distinct cell types, named 'white' and 'opaque'. White and opaque cells differ in metabolic preferences, mating behaviours, cellular morphologies and host interactions. Each cell type is stable through many generations; switching between them is rare, stochastic and occurs without any known changes in the primary sequence of the genome; thus the switch is epigenetic. The white-opaque switch is regulated by a transcriptional circuit, composed of four regulators arranged in a series of interlocking feedback loops. To understand how switching occurs, we investigated the order of regulatory changes that occur during the switch from the opaque to the white cell type. Surprisingly, changes in key transcriptional regulators occur gradually, extending over several cell divisions with little cell-to-cell variation. Additional experiments, including perturbations to regulator concentrations, refine the signature of the commitment point. Transcriptome analysis reveals that opaque cells begin to globally resemble white cells well before they irreversibly commit to switching. We propose that these characteristics of the switching process permit C. albicans to 'test the waters' before making an all-or-none decision.
© 2010 Blackwell Publishing Ltd.
Figures
Similar articles
-
Ssn6 Defines a New Level of Regulation of White-Opaque Switching in Candida albicans and Is Required For the Stochasticity of the Switch.mBio. 2016 Jan 26;7(1):e01565-15. doi: 10.1128/mBio.01565-15. mBio. 2016. PMID: 26814177 Free PMC article.
-
Interlocking transcriptional feedback loops control white-opaque switching in Candida albicans.PLoS Biol. 2007 Oct;5(10):e256. doi: 10.1371/journal.pbio.0050256. PLoS Biol. 2007. PMID: 17880264 Free PMC article.
-
Comparative genomics of white and opaque cell states supports an epigenetic mechanism of phenotypic switching in Candida albicans.G3 (Bethesda). 2021 Feb 9;11(2):jkab001. doi: 10.1093/g3journal/jkab001. G3 (Bethesda). 2021. PMID: 33585874 Free PMC article.
-
White-opaque switching in Candida albicans.Curr Opin Microbiol. 2009 Dec;12(6):650-4. doi: 10.1016/j.mib.2009.09.010. Epub 2009 Oct 23. Curr Opin Microbiol. 2009. PMID: 19853498 Free PMC article. Review.
-
Regulation of white-opaque switching in Candida albicans.Med Microbiol Immunol. 2010 Aug;199(3):165-72. doi: 10.1007/s00430-010-0147-0. Med Microbiol Immunol. 2010. PMID: 20390300 Review.
Cited by
-
Structure of the transcriptional network controlling white-opaque switching in Candida albicans.Mol Microbiol. 2013 Oct;90(1):22-35. doi: 10.1111/mmi.12329. Epub 2013 Aug 25. Mol Microbiol. 2013. PMID: 23855748 Free PMC article.
-
Unbelievable but True: Epigenetics and Chromatin in Fungi.Trends Genet. 2021 Jan;37(1):12-20. doi: 10.1016/j.tig.2020.09.016. Epub 2020 Oct 19. Trends Genet. 2021. PMID: 33092902 Free PMC article. Review.
-
Ras signaling gets fine-tuned: regulation of multiple pathogenic traits of Candida albicans.Eukaryot Cell. 2013 Oct;12(10):1316-25. doi: 10.1128/EC.00094-13. Epub 2013 Aug 2. Eukaryot Cell. 2013. PMID: 23913542 Free PMC article. Review.
-
Discovery of a phenotypic switch regulating sexual mating in the opportunistic fungal pathogen Candida tropicalis.Proc Natl Acad Sci U S A. 2011 Dec 27;108(52):21158-63. doi: 10.1073/pnas.1112076109. Epub 2011 Dec 8. Proc Natl Acad Sci U S A. 2011. PMID: 22158989 Free PMC article.
-
Sexual biofilm formation in Candida tropicalis opaque cells.Mol Microbiol. 2014 Apr;92(2):383-98. doi: 10.1111/mmi.12565. Epub 2014 Mar 19. Mol Microbiol. 2014. PMID: 24612417 Free PMC article.
References
-
- Bergen MS, Voss E, Soll DR. Switching at the cellular level in the white-opaque transition of Candida albicans. J Gen Microbiol. 1990;136:1925–1936. - PubMed
-
- Czerny T, Halder G, Kloter U, Souabni A, Gehring WJ, Busslinger M. twin of eyeless, a second Pax-6 gene of Drosophila, acts upstream of eyeless in the control of eye development. Mol Cell. 1999;3:297–307. - PubMed
-
- de Hoon MJ, Imoto S, Nolan J, Miyano S. Open source clustering software. Bioinformatics. 2004;20:1453–1454. - PubMed
Publication types
MeSH terms
Substances
Grants and funding
LinkOut - more resources
Full Text Sources
