

Molecular analysis of ex-vivo CD133+ GBM cells revealed a common invasive and angiogenic profile but different proliferative signatures among high grade gliomas
- PMID: 20735813
- PMCID: PMC2939550
- DOI: 10.1186/1471-2407-10-454
Molecular analysis of ex-vivo CD133+ GBM cells revealed a common invasive and angiogenic profile but different proliferative signatures among high grade gliomas
Abstract
Background: Gliomas are the most common type of primary brain tumours, and in this group glioblastomas (GBMs) are the higher-grade gliomas with fast progression and unfortunate prognosis. Two major aspects of glioma biology that contributes to its awful prognosis are the formation of new blood vessels through the process of angiogenesis and the invasion of glioma cells. Despite of advances, two-year survival for GBM patients with optimal therapy is less than 30%. Even in those patients with low-grade gliomas, that imply a moderately good prognosis, treatment is almost never curative. Recent studies have demonstrated the existence of a small fraction of glioma cells with characteristics of neural stem cells which are able to grow in vitro forming neurospheres and that can be isolated in vivo using surface markers such as CD133. The aim of this study was to define the molecular signature of GBM cells expressing CD133 in comparison with non expressing CD133 cells. This molecular classification could lead to the finding of new potential therapeutic targets for the rationale treatment of high grade GBM.
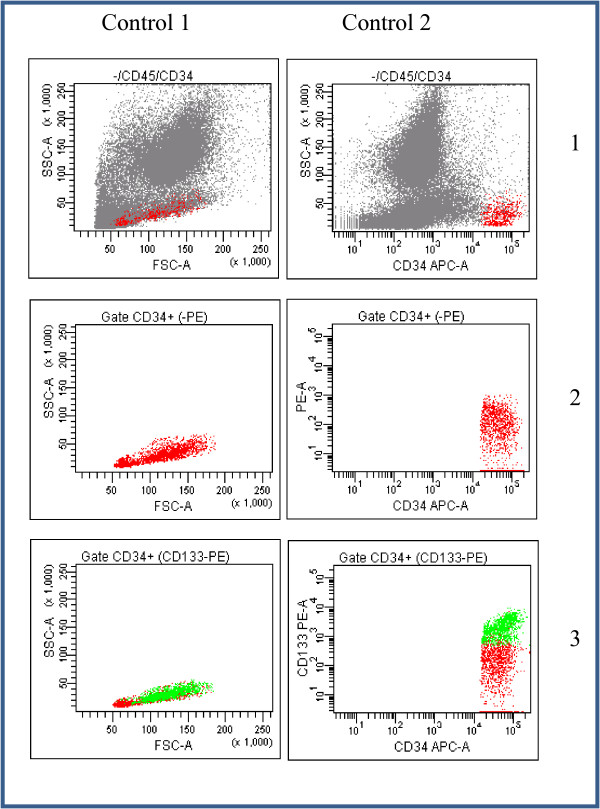
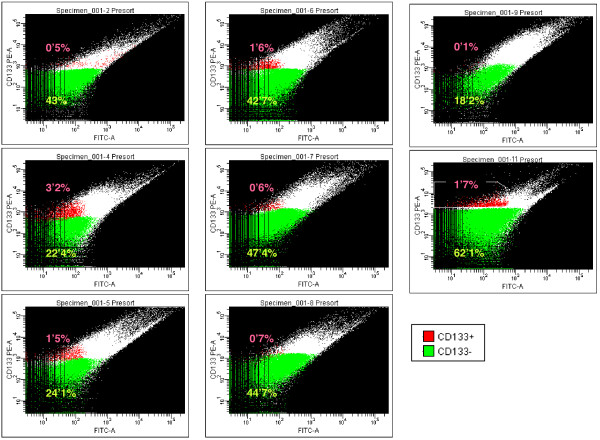
Methods: Eight fresh, primary and non cultured GBMs were used in order to study the gene expression signatures from its CD133 positive and negative populations isolated by FACS-sorting. Dataset was generated with Affymetrix U133 Plus 2 arrays and analysed using the software of the Affymetrix Expression Console. In addition, genomic analysis of these tumours was carried out by CGH arrays, FISH studies and MLPA;
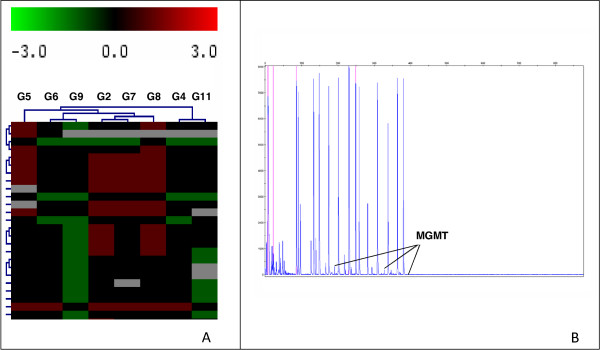
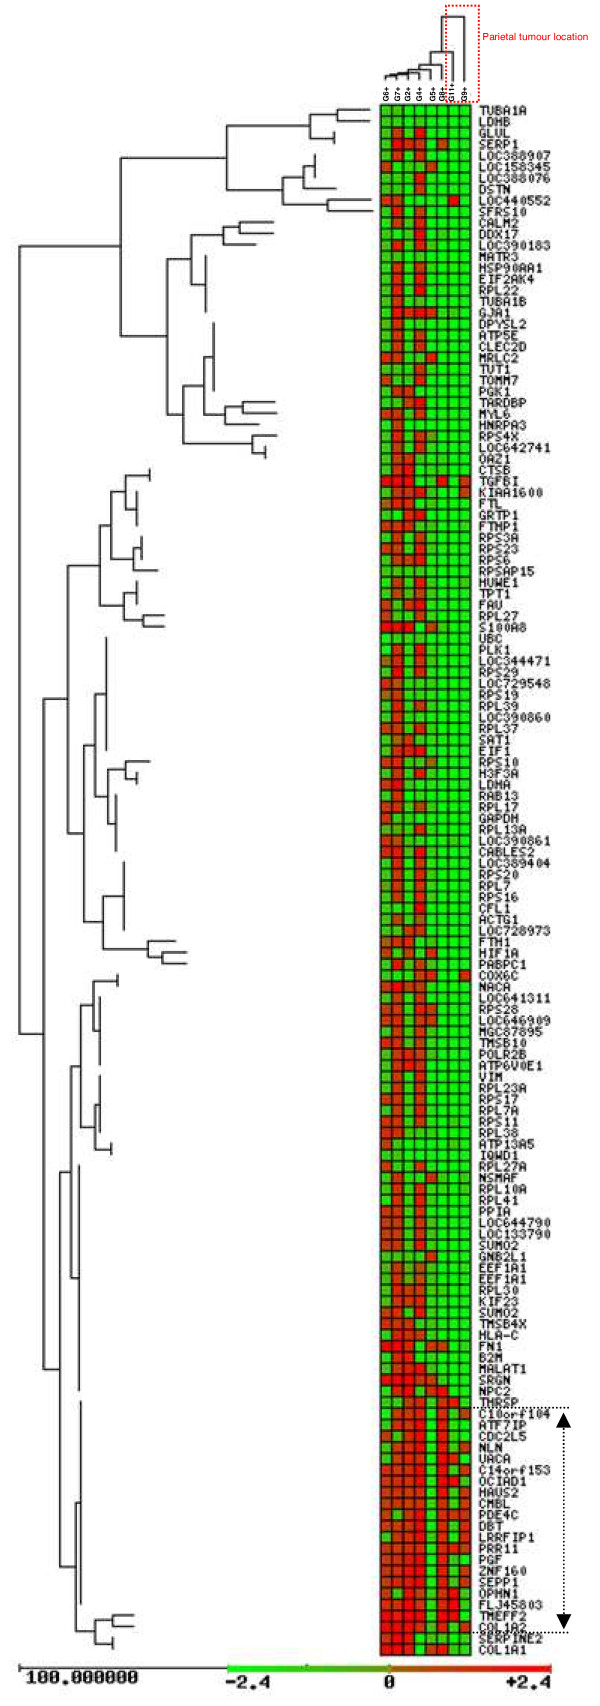
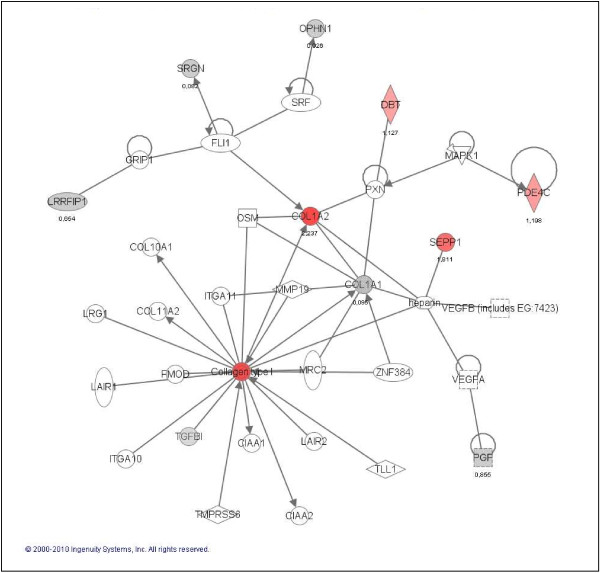
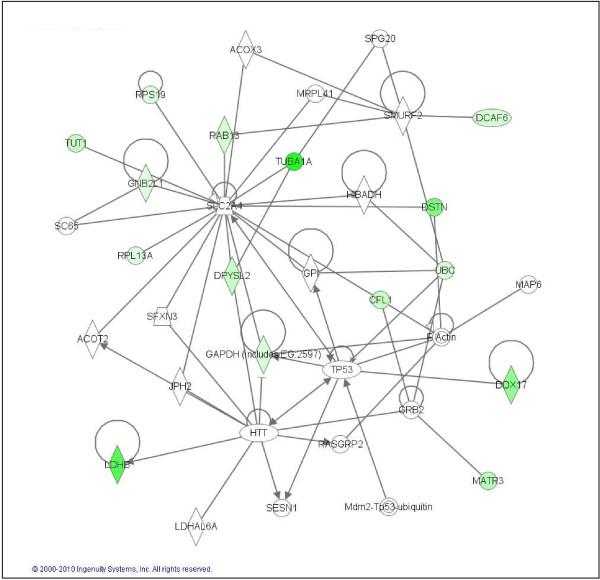
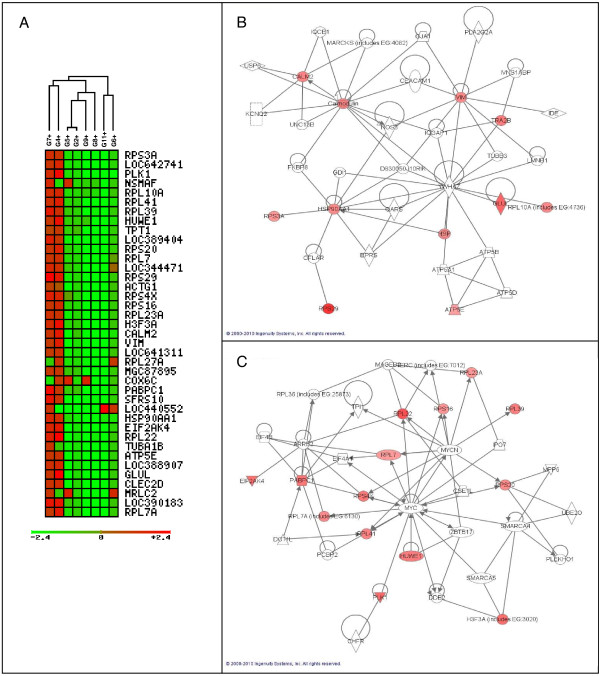
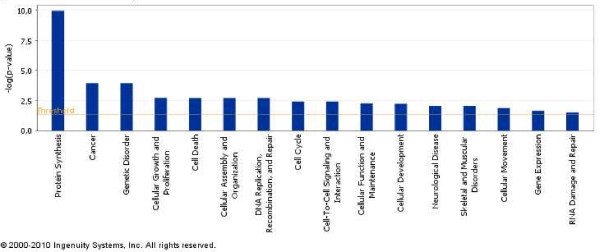
Results: Gene expression analysis of CD133+ vs. CD133- cell population from each tumour showed that CD133+ cells presented common characteristics in all glioblastoma samples (up-regulation of genes involved in angiogenesis, permeability and down-regulation of genes implicated in cell assembly, neural cell organization and neurological disorders). Furthermore, unsupervised clustering of gene expression led us to distinguish between two groups of samples: those discriminated by tumour location and, the most importantly, the group discriminated by their proliferative potential;
Conclusions: Primary glioblastomas could be sub-classified according to the properties of their CD133+ cells. The molecular characterization of these potential stem cell populations could be critical to find new therapeutic targets and to develop an effective therapy for these tumours with very dismal prognosis.
Figures
Similar articles
-
The prognostic value of clinical factors and cancer stem cell-related markers in gliomas.Dan Med J. 2014 Oct;61(10):B4944. Dan Med J. 2014. PMID: 25283629
-
Prognostic impact of CD133 mRNA expression in 48 glioblastoma patients treated with concomitant radiochemotherapy: a prospective patient cohort at a single institution.Ann Surg Oncol. 2011 Oct;18(10):2937-45. doi: 10.1245/s10434-011-1703-6. Epub 2011 Apr 9. Ann Surg Oncol. 2011. PMID: 21479688 Clinical Trial.
-
Investigating the link between molecular subtypes of glioblastoma, epithelial-mesenchymal transition, and CD133 cell surface protein.PLoS One. 2013 May 29;8(5):e64169. doi: 10.1371/journal.pone.0064169. Print 2013. PLoS One. 2013. PMID: 23734191 Free PMC article.
-
CD133 as a marker for regulation and potential for targeted therapies in glioblastoma multiforme.Neurosurg Clin N Am. 2012 Jul;23(3):391-405. doi: 10.1016/j.nec.2012.04.011. Epub 2012 Jun 5. Neurosurg Clin N Am. 2012. PMID: 22748652 Review.
-
Glioblastoma cancer stem cells--from concept to clinical application.Cancer Lett. 2013 Sep 10;338(1):32-40. doi: 10.1016/j.canlet.2012.05.033. Epub 2012 Jun 2. Cancer Lett. 2013. PMID: 22668828 Review.
Cited by
-
IKK/NF-κB signaling contributes to glioblastoma stem cell maintenance.Oncotarget. 2016 Oct 25;7(43):69173-69187. doi: 10.18632/oncotarget.12507. Oncotarget. 2016. PMID: 27732951 Free PMC article.
-
Connexin43 peptide, TAT-Cx43266-283, selectively targets glioma cells, impairs malignant growth, and enhances survival in mouse models in vivo.Neuro Oncol. 2020 Apr 15;22(4):493-504. doi: 10.1093/neuonc/noz243. Neuro Oncol. 2020. PMID: 31883012 Free PMC article.
-
A Short Region of Connexin43 Reduces Human Glioma Stem Cell Migration, Invasion, and Survival through Src, PTEN, and FAK.Stem Cell Reports. 2017 Aug 8;9(2):451-463. doi: 10.1016/j.stemcr.2017.06.007. Epub 2017 Jul 14. Stem Cell Reports. 2017. PMID: 28712848 Free PMC article.
-
Negative allosteric modulators of metabotropic glutamate receptor 3 target the stem-like phenotype of glioblastoma.Mol Ther Oncolytics. 2020 Dec 25;20:166-174. doi: 10.1016/j.omto.2020.12.009. eCollection 2021 Mar 26. Mol Ther Oncolytics. 2020. PMID: 33575479 Free PMC article.
-
Mesenchymal transition and PDGFRA amplification/mutation are key distinct oncogenic events in pediatric diffuse intrinsic pontine gliomas.PLoS One. 2012;7(2):e30313. doi: 10.1371/journal.pone.0030313. Epub 2012 Feb 28. PLoS One. 2012. PMID: 22389665 Free PMC article.
References
-
- Perez-Caro M, Gutierrez-Cianca N, Gonzalez-Herrero I, Lopez-Hernandez I, Flores T, Orfao A, Sanchez-Martin M, Gutierrez-Adan A, Pintado B, Sanchez-Garcia I. Sustained leukaemic phenotype after inactivation of BCR-ABLp190 in mice. Oncogene. 2007;26(12):1702–1713. doi: 10.1038/sj.onc.1209968. - DOI - PubMed
-
- Singh SK, Clarke ID, Terasaki M, Bonn VE, Hawkins C, Squire J, Dirks PB. Identification of a cancer stem cell in human brain tumors. Cancer research. 2003;63(18):5821–5828. - PubMed
Publication types
MeSH terms
Substances
LinkOut - more resources
Full Text Sources
Medical
Molecular Biology Databases
Research Materials
