Comparative Study
. 2010 Aug 24:10:455.
doi: 10.1186/1471-2407-10-455.

Cross-species comparison of aCGH data from mouse and human BRCA1- and BRCA2-mutated breast cancers

Affiliations
Comparative Study

Cross-species comparison of aCGH data from mouse and human BRCA1- and BRCA2-mutated breast cancers

Henne Holstege et al. BMC Cancer. .

Abstract

Background: Genomic gains and losses are a result of genomic instability in many types of cancers. BRCA1- and BRCA2-mutated breast cancers are associated with increased amounts of chromosomal aberrations, presumably due their functions in genome repair. Some of these genomic aberrations may harbor genes whose absence or overexpression may give rise to cellular growth advantage. So far, it has not been easy to identify the driver genes underlying gains and losses. A powerful approach to identify these driver genes could be a cross-species comparison of array comparative genomic hybridization (aCGH) data from cognate mouse and human tumors. Orthologous regions of mouse and human tumors that are commonly gained or lost might represent essential genomic regions selected for gain or loss during tumor development.

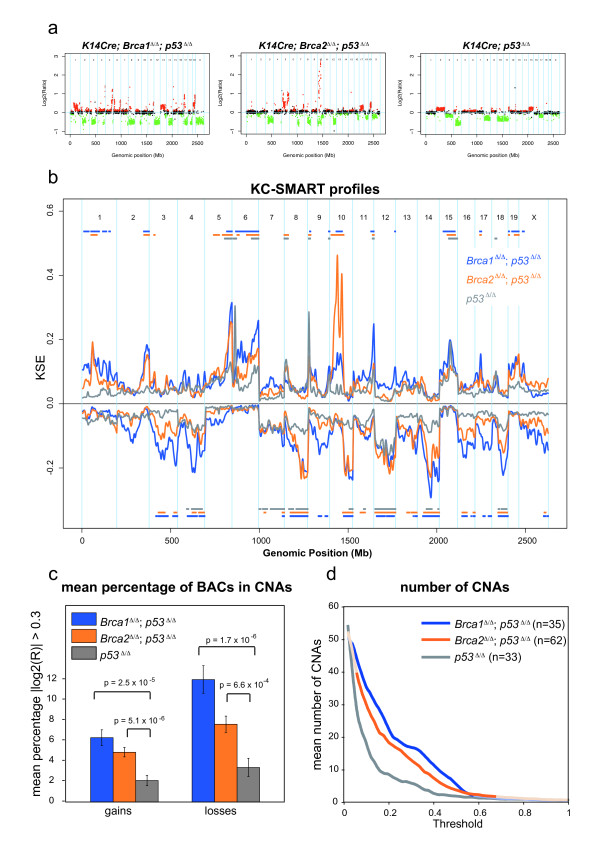
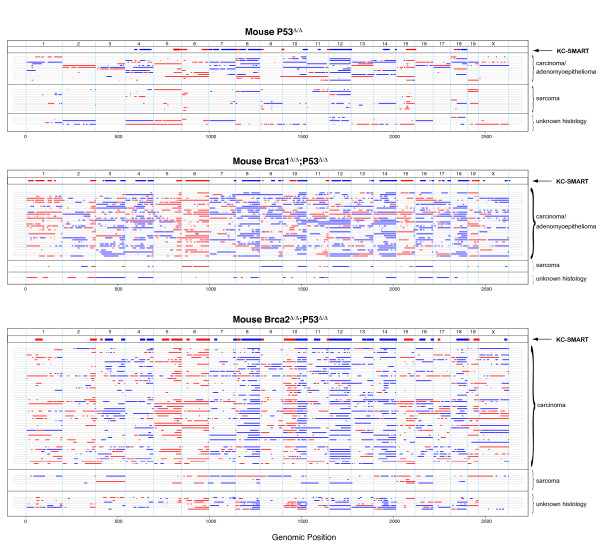
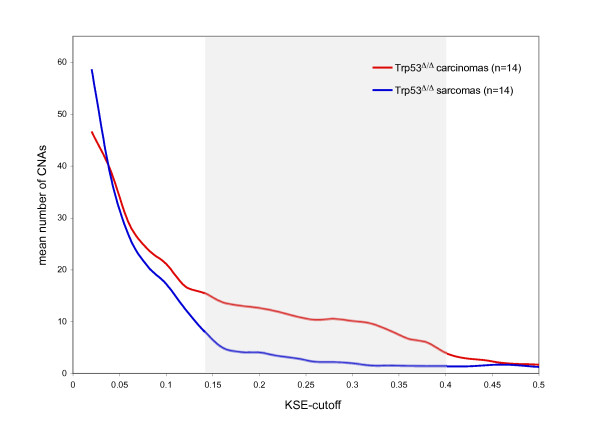
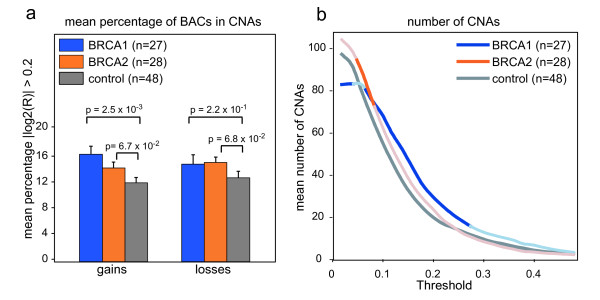
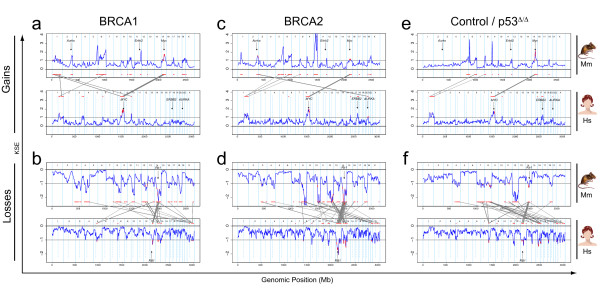
Methods: To identify genomic regions that are associated with BRCA1- and BRCA2-mutated breast cancers we compared aCGH data from 130 mouse Brca1Δ/Δ;p53Δ/Δ, Brca2Δ/Δ;p53Δ/Δ and p53Δ/Δ mammary tumor groups with 103 human BRCA1-mutated, BRCA2-mutated and non-hereditary breast cancers.

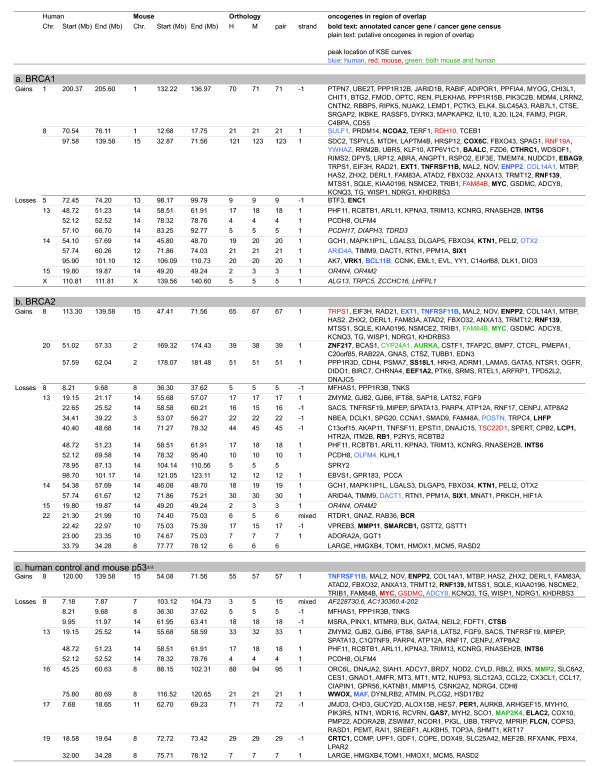
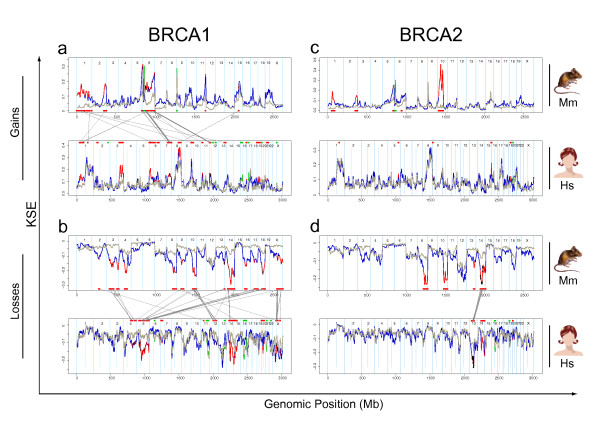
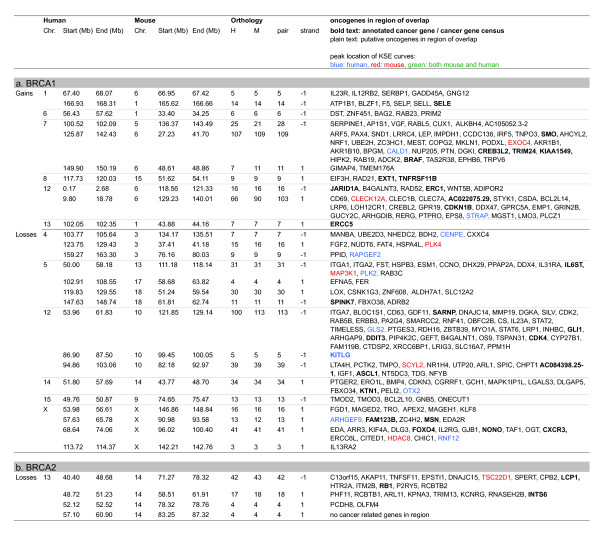
Results: Our genome-wide cross-species analysis yielded a complete collection of loci and genes that are commonly gained or lost in mouse and human breast cancer. Principal common CNAs were the well known MYC-associated gain and RB1/INTS6-associated loss that occurred in all mouse and human tumor groups, and the AURKA-associated gain occurred in BRCA2-related tumors from both species. However, there were also important differences between tumor profiles of both species, such as the prominent gain on chromosome 10 in mouse Brca2Δ/Δ;p53Δ/Δ tumors and the PIK3CA associated 3q gain in human BRCA1-mutated tumors, which occurred in tumors from one species but not in tumors from the other species. This disparity in recurrent aberrations in mouse and human tumors might be due to differences in tumor cell type or genomic organization between both species.

Conclusions: The selection of the oncogenome during mouse and human breast tumor development is markedly different, apart from the MYC gain and RB1-associated loss. These differences should be kept in mind when using mouse models for preclinical studies.


Figures

Figure 1
Figure 1
aCGH profiles of mouse mammary tumors. aCGH profiles typical of (a) Brca1 Δ/Δ;p53Δ/Δ, Brca2Δ/Δ;p53Δ/Δ and p53Δ/Δ mammary tumors. Each dot represents the averaged log2 ratio (y-axis) of a BAC clone plotted at its genomic position (x-axis). Red dots (gains) and green dots (losses) represent datapoints with log2 ratios significantly different from 0 as determined by the Rosetta error model [21]; black dots represent datapoints with log2 ratios not significantly different from 0. Blue vertical lines represent chromosome boundaries. (b) aCGH profiles from 35 Brca1Δ/Δ;p53Δ/Δ tumors (blue), 62 Brca2 Δ/Δ;p53Δ/Δ tumors (orange) and 33 p53Δ/Δ tumors (gray) were analyzed with KC-SMART using a kernel width of 20 Mb, for gains and losses separately. Significant CNAs are depicted in the color matched bars on top (gains) and below (losses) the Kernel Smoothed Estimate curves (KSEs) for each tumor group. (c) The mean percentage of BAC clones ± S.E.M. with absolute log2 ratio > 0.3 is greater across the Brca1Δ/Δ;p53Δ/Δ tumors (blue) and Brca2 Δ/Δ;p53Δ/Δ tumors (orange) tumors compared with the p53Δ/Δ tumors. P-values are determined by a two-tailed t-test with unequal variance. (d) Each individual tumor aCGH profile was smoothed using KC-SMART (kernel width: 20 Mb). For a range of thresholds, all gains exceeding a positive threshold and losses exceeding the same negative threshold were counted and averaged over each tumor group. Curves are darkened at thresholds for which the average number of CNAs per tumor group is significantly greater in the Brca1/2Δ/Δ;p53Δ/Δ tumors compared with the p53Δ/Δ tumors, P < 0.05 determined by a two-tailed t-test with unequal variance.
Figure 2
Figure 2
Gains and losses of individual mouse tumors. To visualize gains and losses of each individual mouse tumor we smoothed their individual CGH profiles with KC-SMART (without separating gains and losses) and depicted the regions which exceeded an arbitrary threshold of 0.15 in line-plots. For those tumors for which the tumor type was known, we stratified according to tumor type. For each tumor depicted in each line, the tumor type information is given in Additional file 3.
Figure 3
Figure 3
Genomic instability of mouse p53Δ/Δ mammary tumors: carcinomas and sarcomas. The 33 p53Δ/Δ tumors consisted of 14 sarcomas, 14 carcinomas/adenomyoepitheliomas and the tumor type of 5 tumors was unknown. To find the difference of genomic instability between carcinomas and sarcomas we smoothed each individual tumor CGH profile using KC-SMART (kernel width: 20 Mb). For a range of thresholds, gains exceeding a positive threshold and losses exceeding the same negative threshold were added and averaged over each tumor group. Between KSE cutoffs of 0.14 and 0.4, the amount of CNAs is significantly different between carcinomas and sarcomas, calculated with a two sided t-test, P < 0.05, and shown by a gray background.
Figure 4
Figure 4
Genomic instability of human BRCA1-mutated, BRCA2-mutated and sporadic control breast tumors. (a) The mean percentage of BAC clones ± S.E.M. with absolute log2 ratio >0.2 is greater in across the 27 BRCA1-mutated tumors (blue) and 28 BRCA2-mutated tumors (orange) compared with 48 sporadic control tumors. P-values are determined by a two-tailed t-test with unequal variance. (b) Each individual tumor aCGH profile was smoothed using KC-SMART (kernel width: 20 Mb). For a range of thresholds, all gains exceeding a positive threshold and losses exceeding the same negative threshold were counted and averaged over each tumor group. Curves are darkened at thresholds for which the average number of CNAs per tumor group is significantly greater in the BRCA1/2-mutated tumors compared with the sporadic control tumors calculated with a two sided t-test with unequal variance, P < 0.05.
Figure 5
Figure 5
Cross species KC-SMART analyses: overlapping recurrent CNAs of human and mouse breast tumors. We analyzed aCGH data from mouse and human tumor groups with the KC-SMART algorithm using a kernel width of 20 Mb. Kernel Smoothed Estimate (KSE) curves are shown for gains and losses separately. For each human-mouse comparison, the upper section shows the KSE curve of the mouse tumor group (Mm) and the lower section shows the human tumor group (Hs). Regions that are gained or lost significantly more often compared to random are depicted in red above or below the KSE curves. Genes that map to a syntenic region of significant gain or loss are plotted in red on the KSE curves and are connected with gray lines between the species. The KSEs of the aCGH data were scaled such that the significance threshold determined by KC-SMART analysis was set at 1 for gains and at -1 for losses. (a) Top panel: the gains on the mouse Brca1Δ/Δ;p53Δ/Δ tumor group linked to the gains of the human BRCA1 tumor group (bottom panel). (b) Top panel: the losses on the mouse Brca1Δ/Δ;p53Δ/Δ tumor group linked to the losses of the human BRCA1 tumor group (bottom panel). (c,d) Idem: mouse Brca2Δ/Δ;p53Δ/Δ and human BRCA2 tumor groups (e,f) Idem: mouse p53Δ/Δ and the human control tumor groups. The genomic locations of MYC, RB1, AURKA and ERBB2 genes are shown. Cancer related genes that map in the overlapping regions are shown in Figure 6 (reduced list) and Additional file 6 (complete list).
Figure 6
Figure 6
Genes in overlapping recurrent CNAs of human and mouse breast tumor determined by cross species KC-SMART analyses. Overview of genes in regions found by cross species KC-SMART analysis (Figure 5): listed are genes that map to significantly recurrent regions of gain and loss that overlap between (a) human BRCA1-mutated breast tumors and mouse Brca1Δ/Δ;p53Δ/Δ mammary tumors, (b) human BRCA2-mutated breast tumors and mouse Brca2Δ/Δ;p53Δ/Δ mammary tumors, (c) human control breast tumors and mouse p53Δ/Δ mammary tumors. The syntenic genomic regions on the human and the mouse genome are listed as well as the amount of mouse genes (M) and human genes (H) mapping within one region of overlap and the amount of unique orthologies for each pair of mouse and human genes (pair). The strand inversion between the two species (when more than one gene maps within the region): 1: no strand inversion, -1: strand inversion. Cancer related genes that map to the regions according to the Atlas of Genetics and Cytogenetics in Oncology and Haematology [44,45], and the Cancer Gene Census [46,47] are listed: annotated cancer genes and genes from the Cancer Gene Census are shown in bold type, putative cancer related genes are shown in normal type. Cancer related genes that map closest to the human KSE peak are shown in blue, genes that map closest to the mouse KSE peak are shown in red, and genes that map to the mouse AND human KSE peaks are shown in green. Overlapping regions with only one orthologue are not shown, for a complete list, including genes removed and added see Additional file 6.
Figure 7
Figure 7
Cross species comparative-KC-SMART analyses. (a) The upper section shows the KSE curves of the gains of the mouse Brca1Δ/Δ;p53Δ/Δ (blue) and p53Δ/Δ (gray) tumor groups. The positions of the genes that map in regions that are aberrated significantly more often in the Brca1Δ/Δ;p53Δ/Δ compared to the p53Δ/Δ group are depicted in red on the blue curve and shown as red bars on the bottom of the panel. Vice versa, the positions of the genes that map in regions that are aberrated significantly more often in the p53Δ/Δ compared to the Brca1Δ/Δ;p53Δ/Δ group are depicted in green on the gray curve and shown as green bars on the bottom of the panel. Similarly, the lower section shows the KSE curves of the gains of the mouse human BRCA1-mutated (blue) and sporadic (gray) tumor groups. Those genes that map to syntentic regions that are differentially aberrated in tumors of both species are connected between the two plots by gray lines. Thicker connecting lines represent multiple genes that map to one syntenic region of gain. (b) Idem: differential losses of the mouse Brca1Δ/Δ;p53Δ/Δ (blue) and p53Δ/Δ tumor groups (gray) and human BRCA1-mutated (blue) and sporadic tumors(gray) (lower section). (c,d) Idem: differential gains and losses of the mouse Brca2Δ/Δ;p53Δ/Δ (blue) and p53Δ/Δ tumor groups (gray) and human BRCA2-mutated (blue) and sporadic tumors(gray) (lower section). Gains: No genes were differentially aberrated in tumors of both species. Cancer related genes that map in the overlapping regions are shown in Figure 8 (abbreviated list) and Additional file 9 (complete list).
Figure 8
Figure 8
Genes in overlapping recurrent CNAs of human and mouse breast tumor determined by cross species comparative-KC-SMART analyses. Overview of genes in regions found by cross species comparative-KC-SMART analysis (Figure 7). Listed are genes that map to significantly differentially gains and losses that overlap (a) between mouse Brca1Δ/Δ;p53Δ/Δ mammary tumors (compared to p53Δ/Δ tumors) and human BRCA1-mutated breast tumors (compared to control tumors) and (b) between mouse Brca2Δ/Δ;p53Δ/Δ mammary tumors (compared to p53Δ/Δ tumors) and BRCA2-mutated breast tumors (compared to control tumors). Idem Figure 6. For complete list see Additional file 9.

Similar articles

Cited by

References

    1. King MC, Marks JH, Mandell JB. Breast and ovarian cancer risks due to inherited mutations in BRCA1 and BRCA2. Science. 2003;302(5645):643–646. doi: 10.1126/science.1088759. - DOI - PubMed
    1. Paakkonen K, Sauramo S, Sarantaus L, Vahteristo P, Hartikainen A, Vehmanen P, Ignatius J, Ollikainen V, Kaariainen H, Vauramo E. et al.Involvement of BRCA1 and BRCA2 in breast cancer in a western Finnish sub-population. Genet Epidemiol. 2001;20(2):239–246. doi: 10.1002/1098-2272(200102)20:2<239::AID-GEPI6>3.0.CO;2-Y. - DOI - PubMed
    1. Hofmann W, Schlag PM. BRCA1 and BRCA2--breast cancer susceptibility genes. J Cancer Res Clin Oncol. 2000;126(9):487–496. doi: 10.1007/s004320000140. - DOI - PubMed
    1. Wooster R, Bignell G, Lancaster J, Swift S, Seal S, Mangion J, Collins N, Gregory S, Gumbs C, Micklem G. Identification of the breast cancer susceptibility gene BRCA2. Nature. 1995;378(6559):789–792. doi: 10.1038/378789a0. - DOI - PubMed
    1. Miki Y, Swensen J, Shattuck-Eidens D, Futreal PA, Harshman K, Tavtigian S, Liu Q, Cochran C, Bennett LM, Ding W. et al.A strong candidate for the breast and ovarian cancer susceptibility gene BRCA1. Science. 1994;266(5182):66–71. doi: 10.1126/science.7545954. - DOI - PubMed

Publication types

MeSH terms