Upregulation of synaptotagmin IV inhibits transmitter release in PC12 cells with targeted synaptotagmin I knockdown
- PMID: 20735850
- PMCID: PMC2939654
- DOI: 10.1186/1471-2202-11-104
Upregulation of synaptotagmin IV inhibits transmitter release in PC12 cells with targeted synaptotagmin I knockdown
Abstract
Background: The function of synaptotagmins (syt) in Ca2+-dependent transmitter release has been attributed primarily to Ca2+-dependent isoforms such as syt I. Recently, syt IV, an inducible Ca2+-independent isoform has been implicated in transmitter release. We postulated that the effects of syt IV on transmitter release are dependent on the expression of syt I.
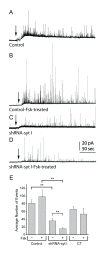
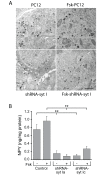
Results: To test this, we increased syt IV expression in PC12 cells by either upregulation with forskolin treatment or overexpression with transfection. Two separately generated stable PC12 cell lines with syt I expression abolished by RNAi targeting were used and compared to control cells. We measured catecholamine release from single vesicles by amperometry and neuropeptide Y release from populations of cells by an immunoassay. In syt I targeted cells with forskolin-induced syt IV upregulation, amperometry measurements showed a reduction in the number of release events and the total amount of transmitter molecules released per cell. In cells with syt IV overexpressed, similar amperometry results were obtained, except that the rate of expansion for full fusion was slowed. Neuropeptide Y (NPY) release from syt I knockdown cells was decreased, and overexpression of syt IV did not rescue this effect.
Conclusions: These data support an inhibitory effect of syt IV on release of vesicles and their transmitter content. The effect became more pronounced when syt I expression was abolished.
Figures


Similar articles
-
Stable gene silencing of synaptotagmin I in rat PC12 cells inhibits Ca2+-evoked release of catecholamine.Am J Physiol Cell Physiol. 2006 Aug;291(2):C270-81. doi: 10.1152/ajpcell.00539.2005. Epub 2006 Feb 8. Am J Physiol Cell Physiol. 2006. PMID: 16467400
-
Titration of synaptotagmin I expression differentially regulates release of norepinephrine and neuropeptide Y.Neuroscience. 2012 Aug 30;218:78-88. doi: 10.1016/j.neuroscience.2012.05.020. Epub 2012 May 17. Neuroscience. 2012. PMID: 22609930
-
Stable RNA interference of synaptotagmin I in PC12 cells results in differential regulation of transmitter release.Am J Physiol Cell Physiol. 2007 Dec;293(6):C1742-52. doi: 10.1152/ajpcell.00482.2006. Epub 2007 Oct 3. Am J Physiol Cell Physiol. 2007. PMID: 17913838
-
Synaptotagmin IV acts as a multi-functional regulator of Ca2+-dependent exocytosis.Neurochem Res. 2011 Jul;36(7):1222-7. doi: 10.1007/s11064-010-0352-7. Epub 2010 Dec 10. Neurochem Res. 2011. PMID: 21153436 Review.
-
How does synaptotagmin trigger neurotransmitter release?Annu Rev Biochem. 2008;77:615-41. doi: 10.1146/annurev.biochem.77.062005.101135. Annu Rev Biochem. 2008. PMID: 18275379 Review.
Cited by
-
PC12 cells that lack synaptotagmin I exhibit loss of a subpool of small dense core vesicles.Biophys J. 2014 Dec 16;107(12):2838-2849. doi: 10.1016/j.bpj.2014.10.060. Biophys J. 2014. PMID: 25517150 Free PMC article.
-
Synaptotagmin 4 Regulates Pancreatic β Cell Maturation by Modulating the Ca2+ Sensitivity of Insulin Secretion Vesicles.Dev Cell. 2018 May 7;45(3):347-361.e5. doi: 10.1016/j.devcel.2018.03.013. Epub 2018 Apr 12. Dev Cell. 2018. PMID: 29656931 Free PMC article.
-
Synaptotagmin 1 is necessary for the Ca2+ dependence of clathrin-mediated endocytosis.J Neurosci. 2012 Mar 14;32(11):3778-85. doi: 10.1523/JNEUROSCI.3540-11.2012. J Neurosci. 2012. PMID: 22423098 Free PMC article.
References
Publication types
MeSH terms
Substances
LinkOut - more resources
Full Text Sources
Molecular Biology Databases
Miscellaneous

