

Cot/tpl2 (MAP3K8) mediates myeloperoxidase activity and hypernociception following peripheral inflammation
- PMID: 20736176
- PMCID: PMC2962480
- DOI: 10.1074/jbc.M110.169409
Cot/tpl2 (MAP3K8) mediates myeloperoxidase activity and hypernociception following peripheral inflammation
Abstract
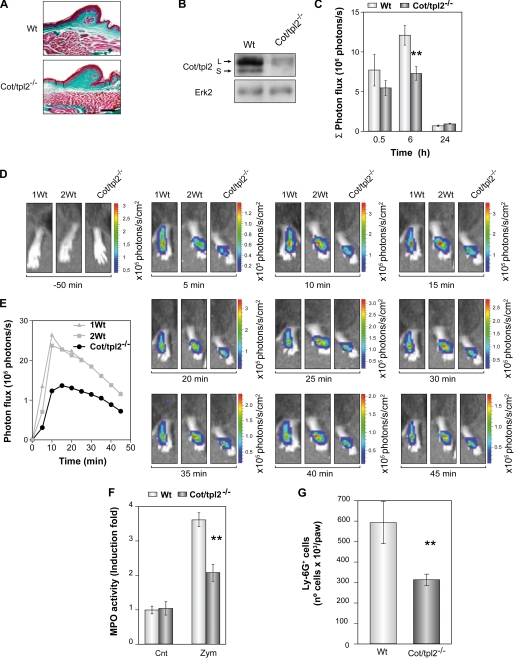
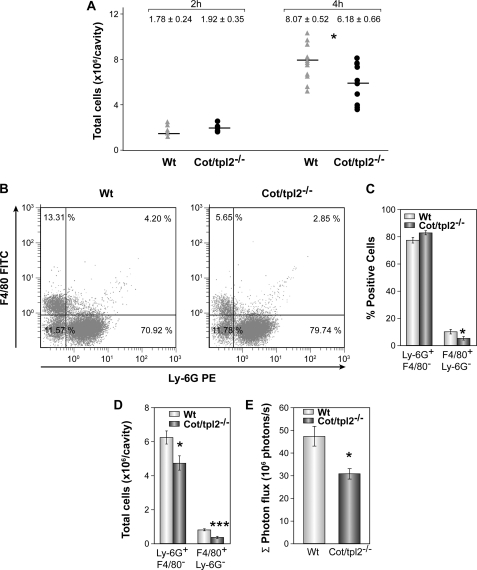
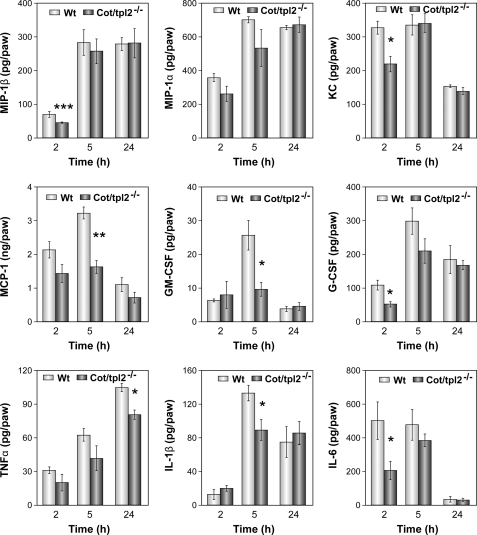
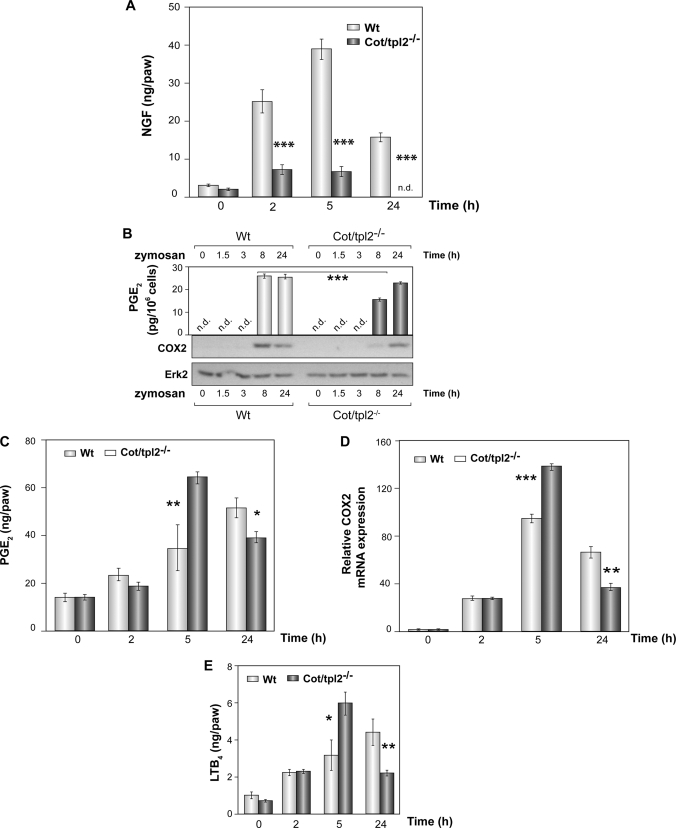
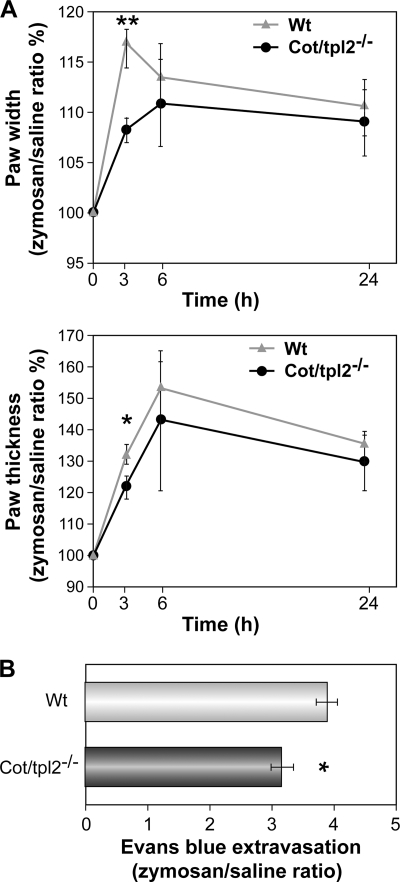
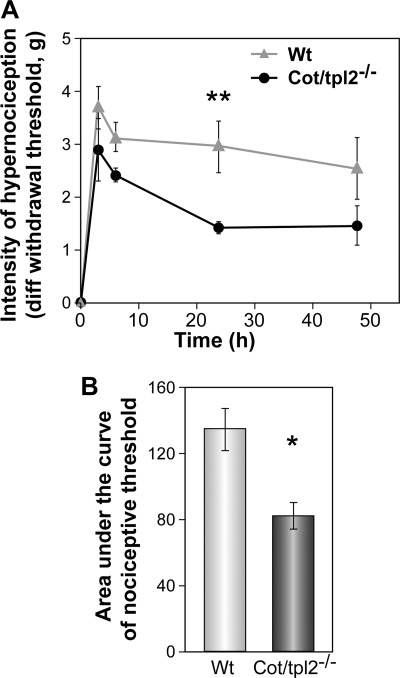
Cot/tpl2 (also known as MAP3K8) has emerged as a new and potentially interesting therapeutic anti-inflammatory target. Here, we report the first study of Cot/tpl2 involvement in acute peripheral inflammation in vivo. Six hours after an intraplantar injection of zymosan, Cot/tpl2(-/-) mice showed a 47% reduction in myeloperoxidase activity, concomitant with a 46% lower neutrophil recruitment and a 40% decreased luminol-mediated bioluminescence imaging in vivo. Accordingly, Cot/tpl2 deficiency provoked a 25-30% reduction in luminol-mediated bioluminescence and neutrophil recruitment together with a 65% lower macrophage recruitment 4 h following zymosan-induced peritonitis. Significantly impaired levels of G-CSF and GM-CSF and of other cytokines such as TNFα, IL-1β, and IL-6, as well as some chemokines such as MCP-1, MIP-1β, and keratinocyte-derived chemokine, were detected during the acute zymosan-induced intraplantar inflammatory response in Cot/tpl2(-/-) mice. Moreover, Cot/tpl2 deficiency dramatically decreased the production of the hypernociceptive ligand NGF at the inflammatory site during the course of inflammation. Most importantly, Cot/tpl2 deficiency significantly reduced zymosan-induced inflammatory hypernociception in mice, with a most pronounced effect of a 50% decrease compared with wild type (WT) at 24 h following intraplantar injection of zymosan. At this time, Cot/tpl2(-/-) mice showed significantly reduced NGF, TNFα, and prostaglandin E(2) levels compared with WT littermates. In conclusion, our study demonstrates an important role of Cot/tpl2 in the NGF, G-CSF, and GM-CSF production and myeloperoxidase activity in the acute inflammatory response process and its implication in inflammatory hypernociception.
Figures
Similar articles
-
Sterile inflammation in acetaminophen-induced liver injury is mediated by Cot/tpl2.J Biol Chem. 2013 May 24;288(21):15342-51. doi: 10.1074/jbc.M112.439547. Epub 2013 Apr 9. J Biol Chem. 2013. PMID: 23572518 Free PMC article.
-
MAP3K8 (TPL2/COT) affects obesity-induced adipose tissue inflammation without systemic effects in humans and in mice.PLoS One. 2014 Feb 24;9(2):e89615. doi: 10.1371/journal.pone.0089615. eCollection 2014. PLoS One. 2014. PMID: 24586913 Free PMC article.
-
Serine/threonine kinase, Cot/Tpl2, regulates renal cell apoptosis in ischaemia/reperfusion injury.Nephrology (Carlton). 2008 Oct;13(5):397-404. doi: 10.1111/j.1440-1797.2008.00959.x. Epub 2008 May 29. Nephrology (Carlton). 2008. PMID: 18518937
-
TPL2 kinase action and control of inflammation.Pharmacol Res. 2018 Mar;129:188-193. doi: 10.1016/j.phrs.2017.11.031. Epub 2017 Nov 26. Pharmacol Res. 2018. PMID: 29183769 Review.
-
Tpl2 kinase signal transduction in inflammation and cancer.Cancer Lett. 2011 May 28;304(2):80-9. doi: 10.1016/j.canlet.2011.02.004. Epub 2011 Mar 5. Cancer Lett. 2011. PMID: 21377269 Review.
Cited by
-
Tumor Progression Locus 2 Promotes Induction of IFNλ, Interferon Stimulated Genes and Antigen-Specific CD8+ T Cell Responses and Protects against Influenza Virus.PLoS Pathog. 2015 Aug 4;11(8):e1005038. doi: 10.1371/journal.ppat.1005038. eCollection 2015 Aug. PLoS Pathog. 2015. PMID: 26241898 Free PMC article.
-
Cot/tpl2-MKK1/2-Erk1/2 controls mTORC1-mediated mRNA translation in Toll-like receptor-activated macrophages.Mol Biol Cell. 2012 Aug;23(15):2982-92. doi: 10.1091/mbc.E12-02-0135. Epub 2012 Jun 6. Mol Biol Cell. 2012. PMID: 22675026 Free PMC article.
-
Hypoxia potentiates monocyte-derived dendritic cells for release of tumor necrosis factor α via MAP3K8.Biosci Rep. 2018 Dec 14;38(6):BSR20182019. doi: 10.1042/BSR20182019. Print 2018 Dec 21. Biosci Rep. 2018. PMID: 30463908 Free PMC article.
-
Deletion of tumor progression locus 2 attenuates alcohol-induced hepatic inflammation.Hepatobiliary Surg Nutr. 2016 Feb;5(1):29-37. doi: 10.3978/j.issn.2304-3881.2015.12.11. Hepatobiliary Surg Nutr. 2016. PMID: 26904554 Free PMC article.
-
Regulation of the inflammatory response: enhancing neutrophil infiltration under chronic inflammatory conditions.J Immunol. 2012 Jan 15;188(2):844-53. doi: 10.4049/jimmunol.1101736. Epub 2011 Dec 7. J Immunol. 2012. PMID: 22156344 Free PMC article.
References
Publication types
MeSH terms
Substances
LinkOut - more resources
Full Text Sources
Medical
Molecular Biology Databases
Research Materials
Miscellaneous
