. 2010 Nov;106(5):663-74.
doi: 10.1093/aob/mcq163. Epub 2010 Aug 24.

Genome-wide analysis of thiourea-modulated salinity stress-responsive transcripts in seeds of Brassica juncea: identification of signalling and effector components of stress tolerance

Affiliations

Genome-wide analysis of thiourea-modulated salinity stress-responsive transcripts in seeds of Brassica juncea: identification of signalling and effector components of stress tolerance

A K Srivastava et al. Ann Bot. 2010 Nov.

Abstract

Background and aims: Abiotic stresses including salinity are the major constraints to crop production. In this regard, the use of thiourea (TU) in imparting salinity-stress tolerance to Indian mustard (Brassica juncea) has been demonstrated earlier. To gain an insight into the mechanism of TU action, various molecular and biochemical studies were conducted.

Methods: Microarray analysis was performed in seeds subjected to distilled water (control), 1 m NaCl, 1 m NaCl + 6·5 mm TU and 6·5 mm TU alone for 1 h. Real-time PCR validation of selected genes and biochemical studies were conducted under similar treatments at 1 h and 6 h.

Key results: The microarray analysis revealed a differential expression profile of 33 genes in NaCl- and NaCl + TU-treated seeds, most of which are established markers of stress tolerance. The temporal regulation of eight selected genes by real-time PCR indicated their early and co-ordinated induction at 1 h in NaCl + TU only. Besides, NaCl + TU-treated seeds also maintained a higher level of abscisic acid, reduced to oxidized glutathione (GSH : GSSG) ratio and activities of catalase, phenylalanine ammonia lyase and glutathione-S-transferases, as compared with that of NaCl treatment. The addition of LaCl(3) (a specific calcium-channel blocker) restricted the responses of TU both at molecular and biochemical level suggesting the possible involvement of a cytosolic calcium burst in the TU-mediated response. The TU-alone treatment was comparable to that of the control; however, it reduced the expression of some transcription factors and heat-shock proteins presumably due to the stabilization of the corresponding proteins.

Conclusions: The TU treatment co-ordinately regulates different signalling and effector mechanisms at an early stage to alleviate stress even under a high degree of salinity. This also indicates the potential of TU to be used as an effective bioregulator to impart salinity tolerance under field conditions.


Figures

Fig. 1.
Fig. 1.
Microarray analysis in Brassica juncea seeds. An overview of microarray analyses (DW vs. N; DW vs. NT and DW vs. T) is represented. Each experiment was performed in triplicate and the average ratios of normalized signals in log2 scale were calculated from three independent replicate experiments using GENESPRING software. The DW, N, NT and T represent distilled water control, NaCl (1 m), NaCl (1 m) + TU (6·5 mm) and TU (6·5 mm) treatments, respectively. Clusters 1 and 2 represent 19 and 14 genes which were down- and up-regulated, respectively, in NaCl but gets modulated under the NaCl + TU treatment. The attached trust represent the scale of expression fold difference (green and red colours represent the down- and up-regulation, respectively).
Fig. 2.
Fig. 2.
Functional classification of TU-modulated and salinity stress-responsive genes. Genes were classified according to the function of the protein that they encode (Provart and Zhu, 2003; www.arabidopsis.org).
Fig. 3.
Fig. 3.
Real-time PCR validation of the selected TU-modulated salinity-responsive genes. The expression level of the selected TU-responsive genes was measured by quantitative real-time PCR in seeds subjected to different treatments for 1 h (A) and 6 h (B), respectively. N, NT, T and NT + LaCl3 represent the different treatments: NaCl (1 m), NaCl (1 m) + TU (6·5 mm), TU (6·5 mm), and NaCl (1 m) + TU (6·5 mm) + LaCl3 (5 mm), respectively. All real-time PCR results were normalized to that of the actin in log2 scale ratio as compared with that of the distilled-water control. The data represent the average of three biological and three technical replicates (± s.d.). The differences in the mean were found to be statistically significant at P < 0·05, in the one-way ANOVA test.
Fig. 4.
Fig. 4.
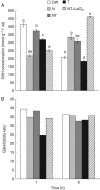
Measurement of GSH and the GSH : GSSG ratio. The level of GSH (A) and the GSH : GSSG ratio (B) were measured in seeds subjected to different treatments for 1 h and 6 h. DW, N, NT, T and NT + LaCl3 represent the different treatments: distilled water control, NaCl (1 m), NaCl (1 m) + TU (6·5 mm), TU (6·5 mm) and NaCl (1 m) + TU (6·5 mm) + LaCl3 (5 mm), respectively. All the values represent the mean ± s.d. of six technical and three biological replicates. The differences in the mean were found to be statistically significant at P < 0·05, in the one-way ANOVA test. Different letters indicate significantly different values at a particular duration (DMRT, P < 0·05).
Fig. 5.
Fig. 5.
Measurement of the ABA content. The endogenous level of ABA was measured in seeds subjected to different treatments for 1 h and 6 h. DW, N, NT, T and NT + LaCl3 represent the different treatments: distilled water control, NaCl (1 m), NaCl (1 m) + TU (6·5 mm), TU (6·5 mm) and NaCl (1 m) + TU (6·5 mm) + LaCl3 (5 mm), respectively. All the values represent the mean ± s.d. of six technical and three biological replicates. The differences in the mean were found to be statistically significant at P < 0·05, in the one-way ANOVA test. Different letters indicate significantly different values at a particular duration (DMRT, P < 0·05).
Fig. 6.
Fig. 6.
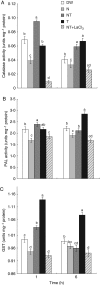
Measurement of enzyme activities. The activities of CAT (A), PAL (B) and GST (C) were measured in seeds subjected to different treatments for 1 h and 6 h. DW, N, NT, T and NT + LaCl3 represent the different treatments: distilled water control, NaCl (1 m), NaCl (1 m) + TU (6·5 mm), TU (6·5 mm) and NaCl (1 m) + TU (6·5 mm) + LaCl3 (5 mm), respectively. All the values represent the mean ± s.d. of six technical and three biological replicates. The differences in the mean were found to be statistically significant at P < 0·05, in the one-way ANOVA test. Different letters indicate significantly different values at a particular duration (DMRT, P < 0·05).

Similar articles

Cited by

References

    1. Aebi H. Catalase in vitro. Methods in Enzymology. 1984;105:121–26. - PubMed
    1. Anterola AM, Lewis NG. Trends in lignin modification: a comprehensive analysis of the effects of genetic manipulations/mutations on lignifications and vascular integrity. Phytochemistry. 2002;61:221–294. - PubMed
    1. Borsani O, Valpuesta V, Botella MA. Evidence for a role of salicylic acid in the oxidative damage generated by NaCl and osmotic stress in Arabidopsis seedlings. Plant Physiology. 2001;126:1024–1030. - PMC - PubMed
    1. Cagnac O, Bourbouloux A, Chakrabarty D, Zhang MY, Delrot S. AtOPT6 transports glutathione derivatives and is induced by primisulfuron. Plant Physiology. 2004;135:1378–1387. - PMC - PubMed
    1. Costa MA, Collins RE, Anterola AM, Cochrane FC, Davin LB, Lewis NG. An in silico assessment of gene function and organization of the phenylpropanoid pathway metabolic networks in Arabidopsis thaliana and limitations thereof. Phytochemistry. 2003;64:1097–1112. - PubMed

MeSH terms