. 2010 Sep 15;123(Pt 18):3125-35.
doi: 10.1242/jcs.064782. Epub 2010 Aug 24.

Formation of extra centrosomal structures is dependent on beta-catenin

Affiliations

Formation of extra centrosomal structures is dependent on beta-catenin

Shirin Bahmanyar et al. J Cell Sci. .

Abstract

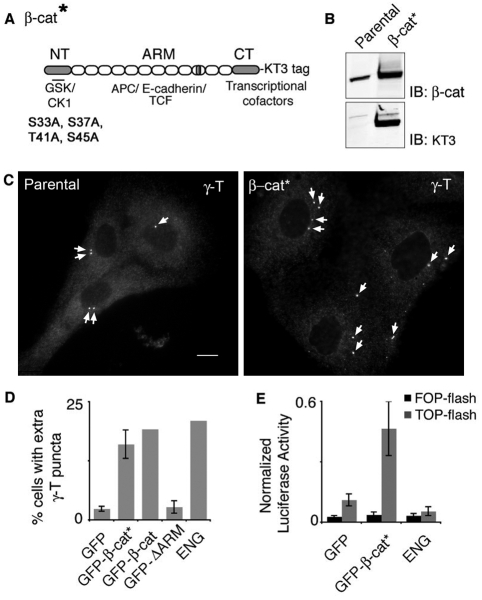
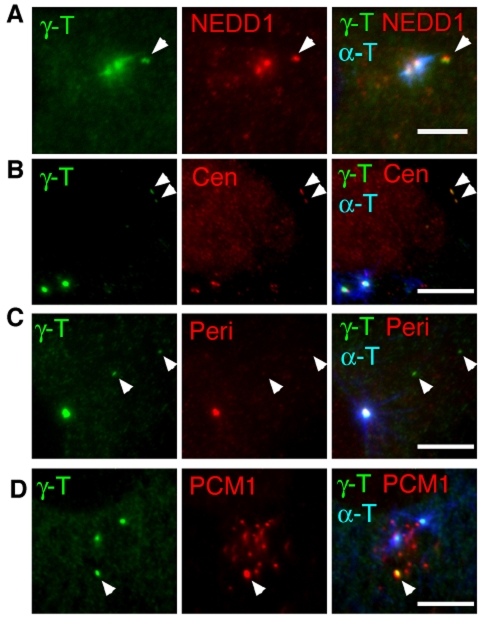
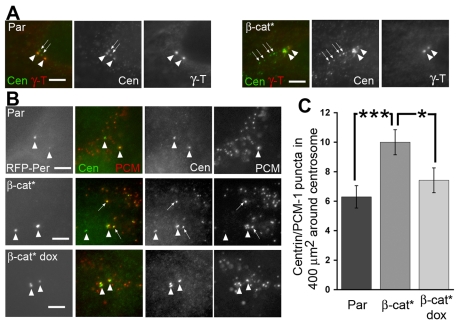
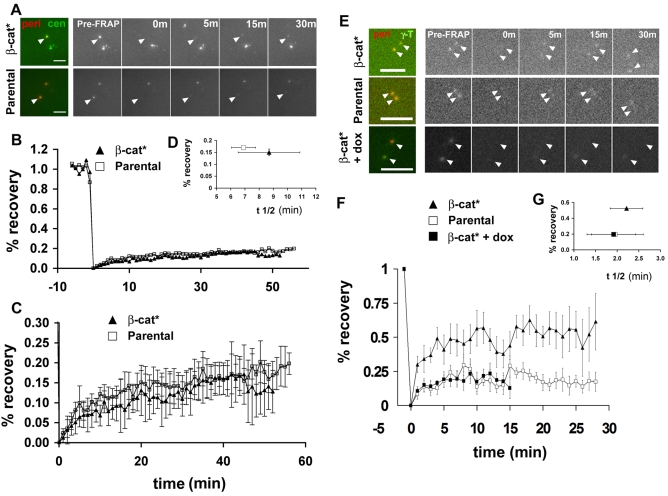
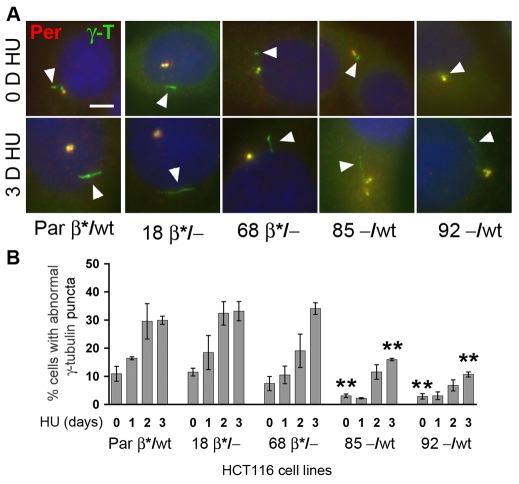
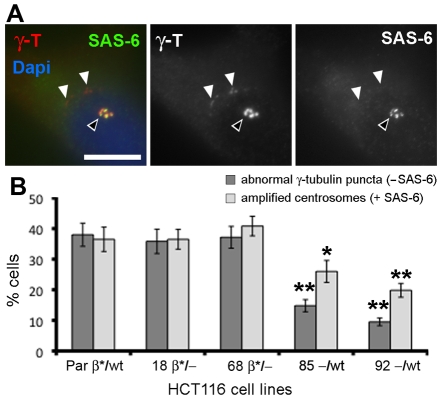
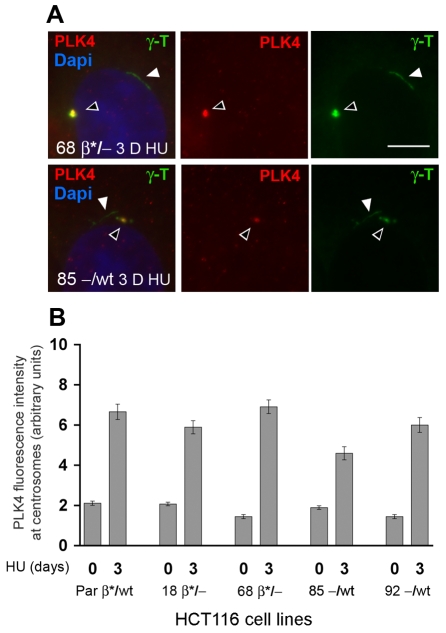
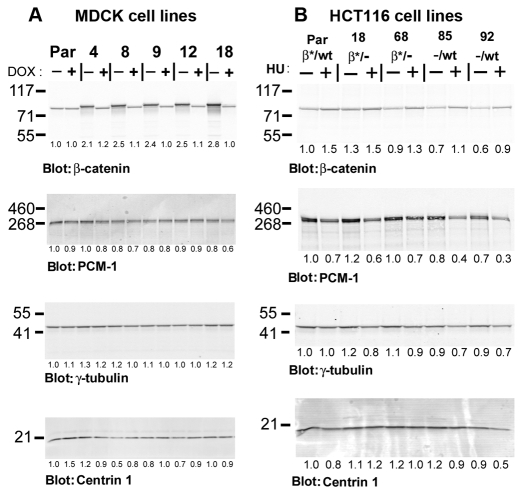
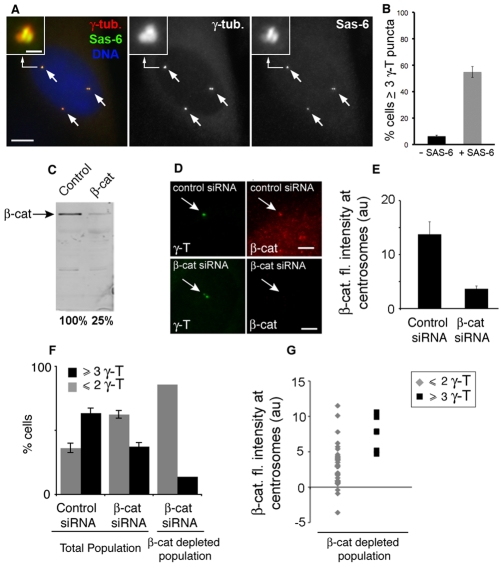
beta-Catenin has important roles in cell-cell adhesion and in the regulation of gene transcription. Mutations that stabilize beta-catenin are common in cancer, but it remains unclear how these mutations contribute to cancer progression. beta-Catenin is also a centrosomal component involved in centrosome separation. Centrosomes nucleate interphase microtubules and the bipolar mitotic spindle in normal cells, but their organization and function in human cancers are abnormal. Here, we show that expression of stabilized mutant beta-catenin, which mimics mutations found in cancer, results in extra non-microtubule nucleating structures that contain a subset of centrosome proteins including gamma-tubulin and centrin, but not polo-like kinase 4 (Plk4), SAS-6 or pericentrin. A transcriptionally inactive form of beta-catenin also gives rise to abnormal structures of centrosome proteins. HCT116 human colon cancer cell lines, from which the mutant beta-catenin allele has been deleted, have reduced numbers of cells with abnormal centrosome structures and S-phase-arrested, amplified centrosomes. RNAi-mediated depletion of beta-catenin from centrosomes inhibits S-phase-arrested amplification of centrosomes. These results indicate that beta-catenin is required for centrosome amplification, and mutations in beta-catenin might contribute to the formation of abnormal centrosomes observed in cancers.


Figures

Fig. 1.
Fig. 1.
Increased levels of β-catenin induce formation of extra γ-tubulin puncta. (A) Schematic representation of β-catenin protein. N-terminal (NT) and C-terminal (CT) domains and the 12 central armadillo repeats are indicated (ARM). Mutations in the CK1 and GSK3β phosphorylation sites to generate stabilized β-cat* were made: S33A, S37A, T41A and S45A. A stretch of unrepeated amino acids in repeat 10 (gray box) is shown. The CK1 and GSK3β phosphorylation sites (NT), Adenomatous polyposis coli (APC), E-cadherin, and T-cell factor (TCF) binding sites (ARM), transcriptional cofactor binding region (CT) and the KT3 tag used in stable cell lines are shown. (B) Immunoblot of whole-cell lysate from parental MDCK and β-cat*-expressing cells. (C) Parental and β-cat*-expressing cells immunostained for γ-tubulin (arrows). β-cat*-expressing cells have three or more γ-tubulin puncta. Scale bar: 10 μm. (D) Percentage of cells with three or more γ-tubulin puncta in MDCK cells transiently transfected with indicated constructs: pEGFP-C1 (GFP), GFP-S33A/S37A/T41A/S45A-β-cat* in pEGFP-C1 (GFP-b-cat*), GFP-β-catenin in pEGFP-C1, GFP-β-catenin without the ARM domain (GFP-ΔARM; Elul et al., 2003), β-catenin–engrailed chimera (ENG; Montross et al., 2000). Bars show s.e.m. of three experiments. Mean value is shown for experiments performed twice. (E) TCF reporter assays (TOP-Flash) and control reporter assays (FOP-Flash) were performed on lysates from MDCK cells transiently transfected with the indicated constructs. Error bars represent s.e.m.
Fig. 2.
Fig. 2.
Non-MT-nucleating γ-tubulin puncta contain NEDD-1, centrin and PCM-1, but not pericentrin. (A–D) Centrosomal areas of β-cat*-expressing cells immunostained after nocodazole washout for γ-tubulin (green in A–D) and co-immunostained for NEDD-1 (red in A), centrin (red in B), pericentrin (red in C) or PCM1 (red in D) and α-tubulin (blue in merge A–D). Arrowheads indicate non-MT-nucleating puncta. Scale bars: 5 μm.
Fig. 3.
Fig. 3.
β-Cat* induces accumulation of satellites containing PCM-1 and centrin around centrosomes. (A) 400 μm2 centrosome areas of parental MDCK cells (Par) or MDCK cells expressing β-cat* magnified to show centrin puncta (some are indicated with arrows) close to centrosomes (arrowheads) stained with γ-tubulin and centrin. Each panel shows, from left to right, the merged image, the single image for centrin and the single image for γ-tubulin. Additional centrin-containing puncta (arrows) around centrosomes (arrowheads) in cells expressing stabilized β-cat* do not colocalize with γ-tubulin. (B) MDCK cells were transfected with RFP-pericentrin as a marker for centrosomes and co-immunostained for centrin and PCM-1. Magnified 400 μm2 centrosome area in parental cell (Par in top row), in a cell expressing stabilized β-cat* (β-cat* in middle row) or in a cell in which expression of β-cat* was turned off with dox (β-cat* dox in bottom row) each expressing RFP-pericentrin (first column) and co-immunostained for centrin and PCM-1 (second column, centrin and PCM-1 merged images; third column, centrin; fourth column, PCM-1). (C) Mean number (± s.e.m.) of centrin and PCM-1 puncta in 400 μm2 around centrosomes labeled with RFP-pericentrin (Parental, n=44; β-cat*, n=39; β-cat* dox, n=36). ***P=0.0004; *P=0.02 in two-tailed Mann-Whitney test. Scale bars: 5 μm.
Fig. 4.
Fig. 4.
β-Cat* does not affect centrin turnover, but increases the mobile fraction of γ-tubulin at centrosomes. (A) Representative montages of GFP-centrin FRAP experiments in β-cat* and parental MDCK cell lines. These cell lines were transiently transfected with GFP-centrin and RFP-pericentrin. Left panel is a merged image showing colocalization at centrosomes. Right panel shows GFP-centrin fluorescence before (Pre-FRAP), immediately after (0m) and 5, 15 and 30 minutes after photobleaching. Scale bars: 5 μm. (B) Quantification of centrin FRAP experiments. GFP-centrin was measured centered on the pericentrin marker (see Materials and Methods) and values were normalized. (C) Same quantification as shown in B, focusing on values in the lower part of the y-axis. Error bars indicate s.e.m. (n=6 for parental, n=8 for β-cat*). (D) Data were fitted to an exponential; maximal recovery is 17±0.7% for parental and 15±1.4% for β-cat*. The half-life (t1/2) is 7±0.9 minutes for parental and 9±2.2 minutes for β-cat*. (E) Representative montages of GFP-γ-tubulin FRAP experiments in β-cat* and parental MDCK cell lines, and β-cat* MDCK cells in which expression of β-cat* was repressed with doxycycline (+dox). These cell lines were transiently transfected with GFP-γ-tubulin and RFP-pericentrin. Left panel is a merge showing colocalization at centrosomes. Right panel shows GFP-γ-tubulin fluorescence before (Pre-FRAP), immediately after (0m) and 5, 15 and 30 minutes after photobleaching. Scale bars: 10 μm. (F) Quantification of γ-tubulin FRAP experiments. GFP-γ-tubulin was measured centered on the pericentrin marker and values were normalized. Error bars indicate s.e.m. (n=7 for parental, n=9 for β-cat.*, n=5 for β-cat.* + dox). (G) Data were fitted to an exponential and values for maximal recovery and half-life were calculated (maximal recovery, 20±1% in parental cells and β-cat* + dox; 53±2% in cells expressing stabilized β-cat*; t1/2=2.0±0.7 minutes for parental; 2.2±0.4 minutes for β-cat* and 1.9±0.5 minutes for β-cat* + dox). For β-cat* + dox, FRAP was measured for the first 15 minutes only.
Fig. 5.
Fig. 5.
Removal of the mutant β-cat* allele from colon cancer cell line HCT116 decreases the number of cells forming abnormal γ-tubulin puncta. (A) Parental (Par) HCT116 cells that have a mutant (β*) β-catenin allele and a wild-type (wt) β-catenin allele (Par β*/wt) or independent clones of HCT116 cells in which either the wt allele has been removed (18 β*/−; 68 β*/−) or the mutant allele has been removed (85 −/wt; 92 −/wt) have been left untreated (0 D HU) or S-phase-arrested for 3 days with hydroxyurea (3 D HU). Images show magnified 400 μm2 areas around centrosomes co-stained for pericentrin (red) and γ-tubulin (green). Parental and all clones show extra γ-tubulin-containing puncta near centrosomes that do not contain pericentrin (arrowheads). In S-phase-arrested cells (3 D HU) these extra γ-tubulin puncta are elongated (arrowheads in bottom panel). Scale bar: 5 μm. (B) Quantification of cells with abnormal γ-tubulin puncta. Bars represent s.e.m. of five experiments for 0 and 3 days of hydroxyurea (HU) treatment and s.e.m. of three independent experiments for 1 and 2 days of hydroxyurea (HU) treatment. **P<0.009 for 0 and 3 days HU compared with Par β*/wt.
Fig. 6.
Fig. 6.
The centriole marker SAS-6 does not localize to abnormal γ-tubulin puncta in S-phase-arrested HCT116 cells and removal of the mutant β-cat* allele inhibits centriole amplification. (A) HCT116 line 18 with one mutant (β*) β-catenin allele (18 β*/−) was S-phase-arrested for 3 days with hydroxyurea. Images show the magnified area around amplified centrosomes co-stained for γ-tubulin (red) and SAS-6 (green). SAS-6 localizes to amplified centrosomes (black arrowheads) but not to extra γ-tubulin puncta (white arrowheads). Scale bar: 10 μm. (B) HCT116 cell lines S-phase-arrested for 3 days with hydroxyurea were quantified for the number of cells with abnormal γ-tubulin puncta (dark bars) that are SAS-6-negative or number of cells with amplified centrosomes (light bars) that have more than four centrioles labeled with SAS-6. Bars represent s.e.m. of five to six experiments; *P<0.05 and **P≤0.008 compared with parental cells in a one-tailed Mann-Whitney test. Cells with only one wild-type allele of β-catenin have significantly fewer abnormal γ-tubulin puncta and amplified centrosomes.
Fig. 7.
Fig. 7.
Mutant β-cat* does not affect Plk4 levels at centrosomes in colon cancer HCT116 cells. (A) Plk4 (red), DAPI (blue) and γ-tubulin (green) co-staining of HCT116 cell lines 68 β*/− and 85 −/wt treated for 3 days with hydroxyurea (3 D HU). Plk4 (red) colocalizes with γ-tubulin at centrosomes (black arrowheads), but not at abnormal elongated γ-tubulin structures (white arrowheads). Scale bar: 10 μm. (B) Quantification of Plk4 fluorescence intensity at centrosome areas in untreated HCT116 cell lines (0 days HU) or in S-phase-arrested HCT116 cell lines (3 days HU). Bars represent s.e.m. of more than 50 centrosome areas measured for each cell line. Plk4 levels are increased in S-phase-arrested compared with untreated cells because of centrosome amplification. Although there are some variations in Plk4 levels at centrosome areas between different cell lines, cell lines with mutant β-cat* do not show a consistent increase or decrease in Plk4 levels compared with cell lines that have only wt β-catenin.
Fig. 8.
Fig. 8.
Expression of mutant β-cat* does not significantly change total cellular levels of PCM-1, γ-tubulin or centrin. (A) SDS extracts from MDCK cell lines expressing mutant S33A/S37A/T41A/S45A β-cat* (4, 8, 9 and 12, −DOX) or not expressing mutant β-cat* (Par ±DOX and 4, 8, 9 and 12, +DOX) were immunoblotted for total β-catenin, PCM-1, γ-tubulin or centrin 1. (B) SDS extracts from asynchronous (−HU) or 3 days S-phase-arrested (+HU) HCT116 cell lines containing (Par, 18, 68) or not containing (85, 92) the mutant ΔS45 β-catenin allele were immunoblotted for total β-catenin, PCM-1, γ-tubulin or centrin 1. Numbers below blots represent the percentage of signal intensity for each protein compared with signal intensity for parental lines (Par, −DOX for MDCK and Par for HCT116) in each blot.
Fig. 9.
Fig. 9.
Depletion of β-catenin with siRNA inhibits amplification of centrosomes in hydroxyurea-treated U-2OS cells. (A) U-2OS cultures were S-phase-arrested for 96 hours in HU and co-stained for γ-tubulin (red in A), SAS-6 (green in A) and DNA (blue in A). Scale bar: 10 μm. Inserts in A show magnified area of one of the three γ-tubulin and SAS-6 puncta in the cell. Scale bar: 1 μm. (B) Percentage of cells with three or more SAS-6-negative or SAS-6-positive γ-tubulin puncta was determined. Error bars are s.e.m. of three experiments. (C) SDS lysates from U-2OS cultures treated with control and β-catenin siRNA incubated for 96 hours in HU were loaded equally and immunoblotted for β-catenin. (D) Representative examples of centrosome region (arrows) of cells treated with control and β-catenin siRNA immunostained for γ-tubulin (green) and β-catenin (red). Scale bars: 2 μm. (E) Normalized fluorescence intensity of β-catenin at centrosomes in control (n=14) and β-catenin siRNA cells (n=42). Fluorescence intensity of β-catenin at centrosomes in siRNA-treated cells was significantly reduced. (F) Histogram showing in a total population the percentage of HU-treated control (n=368) or β-catenin siRNA (n=321) cells with two or fewer γ-tubulin puncta (gray bars) or three or more γ-tubulin puncta (black bars). Bars represent s.e.m. of four experiments. Portion of graph representing β-catenin-depleted population shows percentage of HU-treated β-catenin siRNA cells depleted for β-catenin at centrosomes, with indicated number of γ-tubulin puncta (n=42). Percentage of cells with three or fewer γ-tubulin puncta is significantly reduced in cells depleted of β-catenin. (G) Fluorescence intensity measurements of β-catenin at centrosomes in knockdown cells from F. Diamonds represent cells with two or fewer γ-tubulin puncta; squares represent cells with three or more γ-tubulin puncta. 71% of cells with two or fewer γ-tubulin puncta in β-catenin siRNA cells had fluorescence intensities less than 4.5 a.u.

Similar articles

Cited by

References

    1. Aldaz H., Rice L. M., Stearns T., Agard D. A. (2005). Insights into microtubule nucleation from the crystal structure of human gamma-tubulin. Nature 435, 523-527 - PubMed
    1. Bahmanyar S., Kaplan D. D., Deluca J. G., Giddings T. H., Jr, O'Toole E. T., Winey M., Salmon E. D., Casey P. J., Nelson W. J., Barth A. I. (2008). b-Catenin is a Nek2 substrate involved in centrosome separation. Genes Dev. 22, 91-105 - PMC - PubMed
    1. Balczon R., Bao L., Zimmer W. E. (1994). PCM-1, A 228-kD centrosome autoantigen with a distinct cell cycle distribution. J. Cell Biol. 124, 783-793 - PMC - PubMed
    1. Baron A. T., Salisbury J. L. (1988). Identification and localization of a novel, cytoskeletal, centrosome-associated protein in PtK2 cells. J. Cell Biol. 107, 2669-2678 - PMC - PubMed
    1. Barth A. I., Pollack A. L., Altschuler Y., Mostov K. E., Nelson W. J. (1997). NH2-terminal deletion of beta-catenin results in stable colocalization of mutant beta-catenin with adenomatous polyposis coli protein and altered MDCK cell adhesion. J. Cell Biol. 136, 693-706 - PMC - PubMed

Publication types