

The relationship between prostate-specific antigen and prostate cancer risk: the Prostate Biopsy Collaborative Group
- PMID: 20736330
- PMCID: PMC2937360
- DOI: 10.1158/1078-0432.CCR-10-1328
The relationship between prostate-specific antigen and prostate cancer risk: the Prostate Biopsy Collaborative Group
Erratum in
- Clin Cancer Res. 2011 Jun 1;17(11):3852
Abstract
Purpose: The relationship between prostate-specific antigen (PSA) level and prostate cancer risk remains subject to fundamental disagreements. We hypothesized that the risk of prostate cancer on biopsy for a given PSA level is affected by identifiable characteristics of the cohort under study.
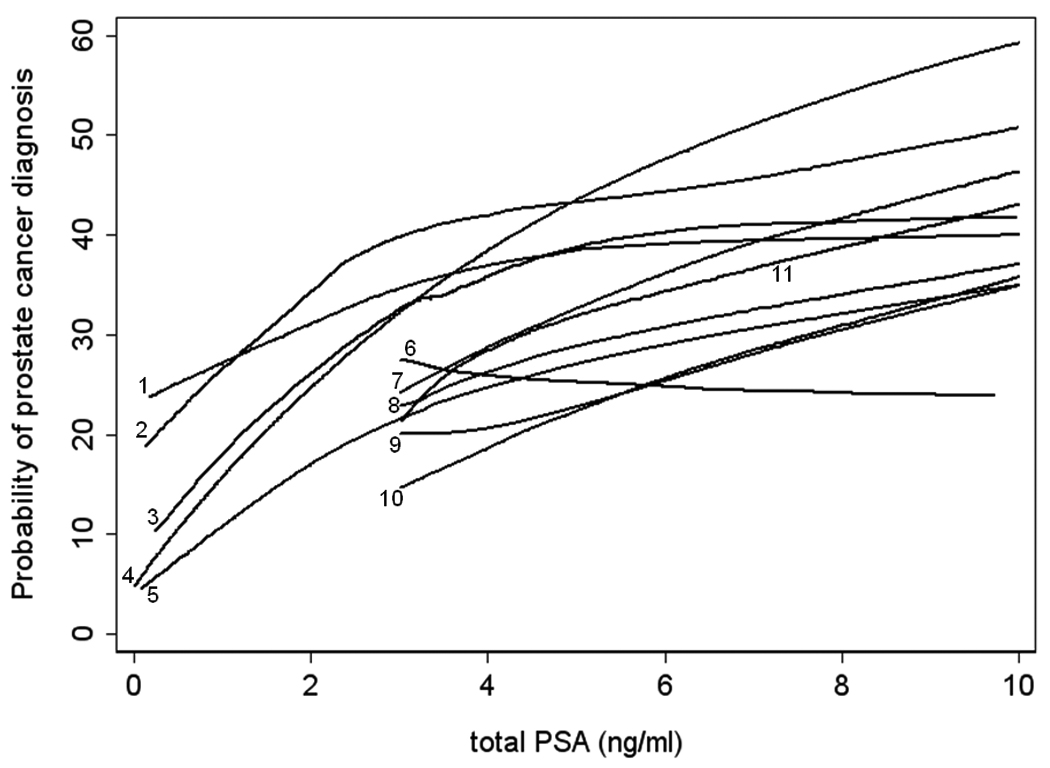
Experimental design: We used data from five European and three U.S. cohorts of men undergoing biopsy for prostate cancer; six were population-based studies and two were clinical cohorts. The association between PSA and prostate cancer was calculated separately for each cohort using locally weighted scatterplot smoothing.
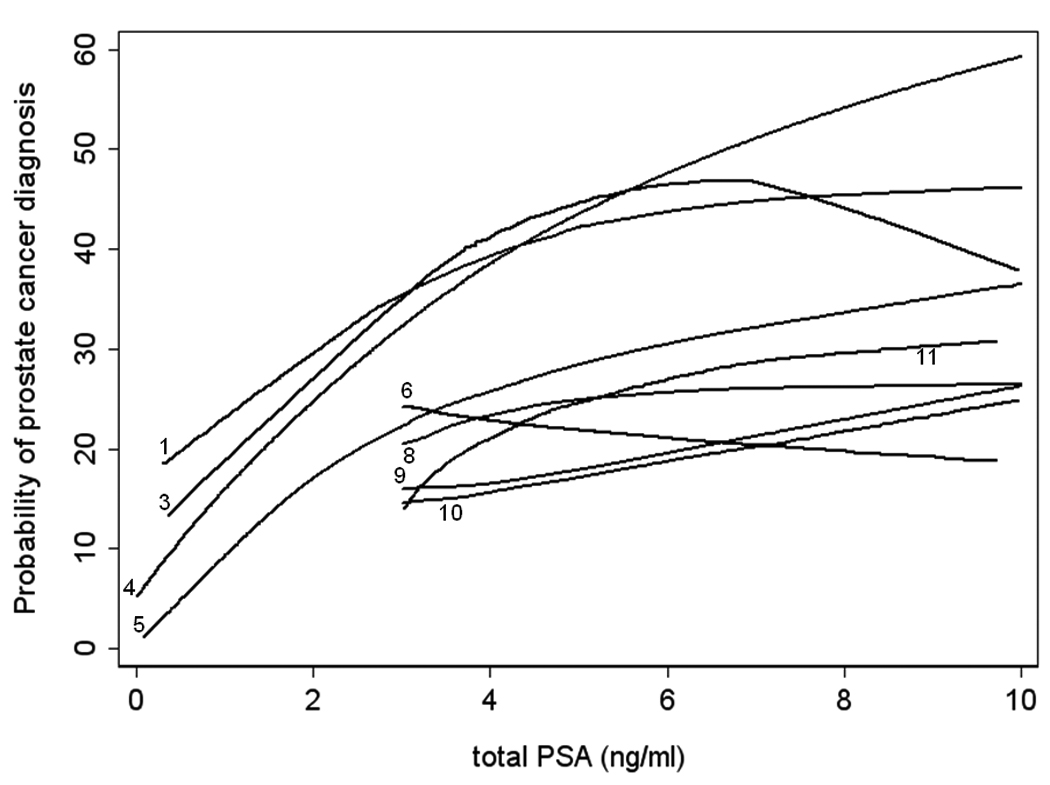
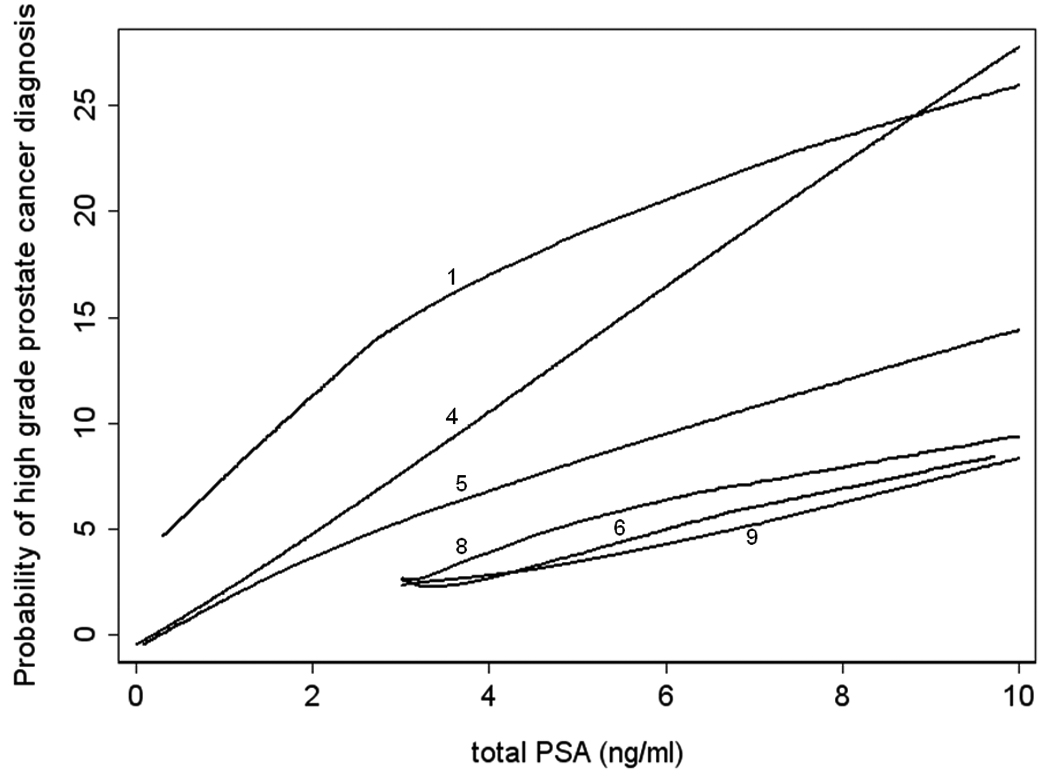
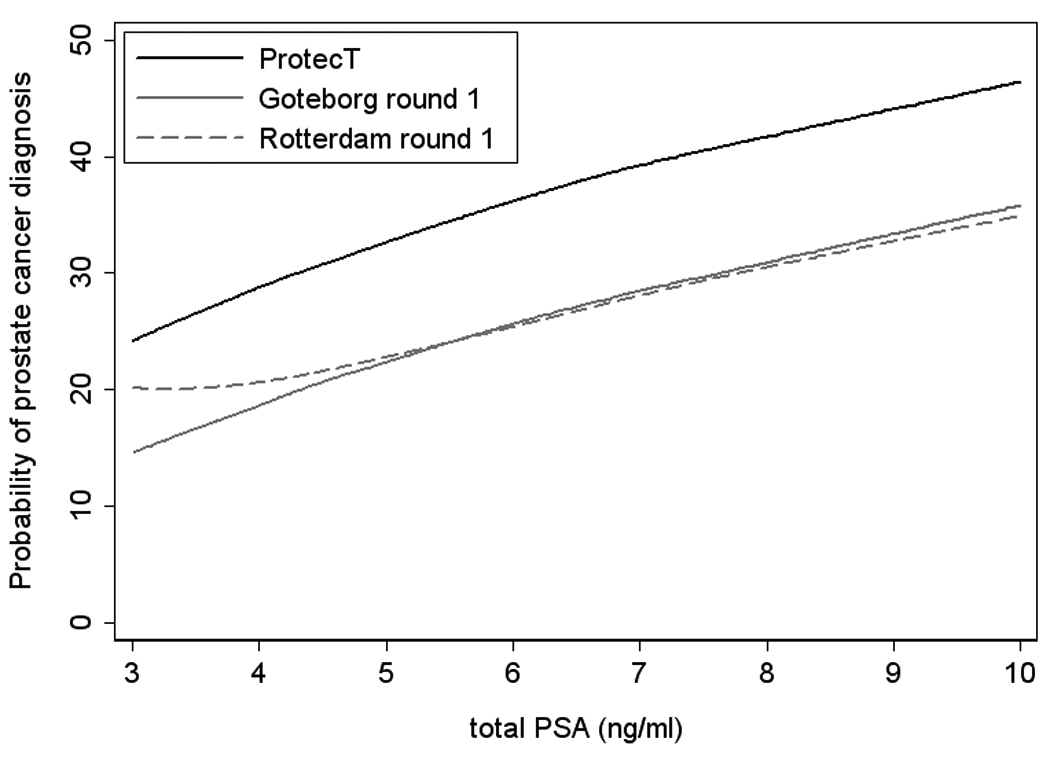
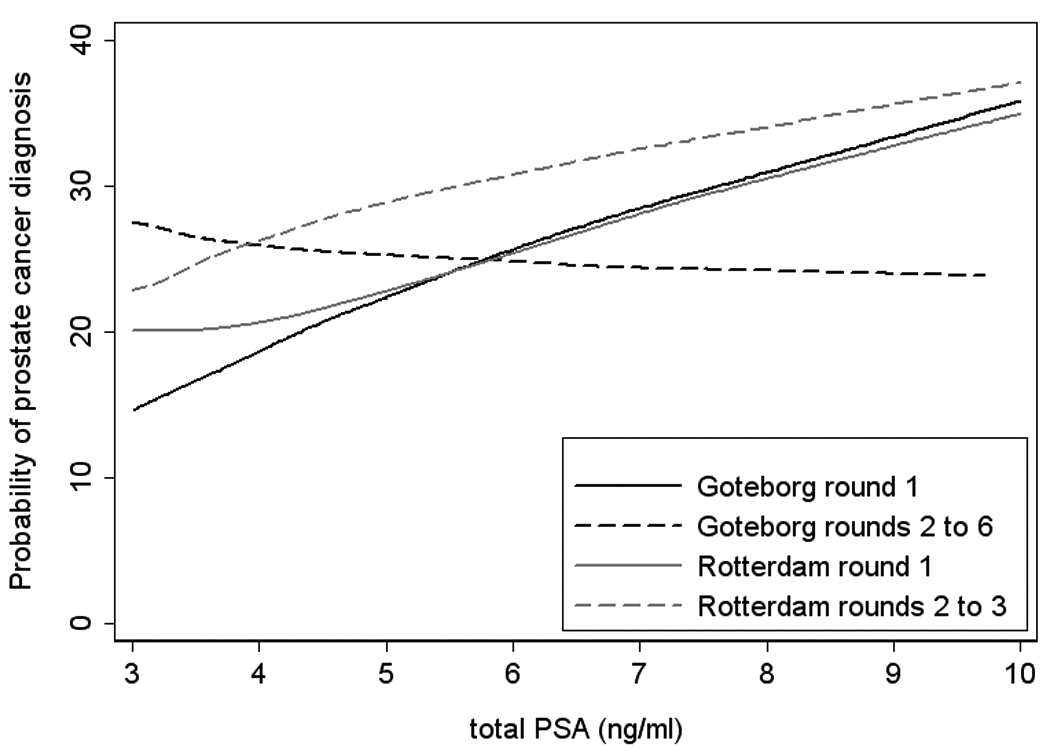
Results: The final data set included 25,772 biopsies and 8,503 cancers. There were gross disparities between cohorts with respect to both the prostate cancer risk at a given PSA level and the shape of the risk curve. These disparities were associated with identifiable differences between cohorts: for a given PSA level, a greater number of biopsy cores increased the risk of cancer (odds ratio for >6- versus 6-core biopsy, 1.35; 95% confidence interval, 1.18-1.54; P < 0.0005); recent screening led to a smaller increase in risk per unit change in PSA (P = 0.001 for interaction term) and U.S. cohorts had higher risk than the European cohorts (2.14; 95% confidence interval, 1.99-2.30; P < 0.0005).
Conclusions: Our results suggest that the relationship between PSA and risk of a positive prostate biopsy varies, both in terms of the probability of prostate cancer at a given PSA value and the shape of the risk curve. This poses challenges to the use of PSA-driven algorithms to determine whether biopsy is indicated.
Figures
Cleveland Clinic
Durham VA
SABOR
PCPT
Tyrol
Göteborg rounds 2 to 6
ProtecT
Rotterdam rounds 2 to 3
Rotterdam round 1
Göteborg round 1
Tarn
Cleveland Clinic
Durham VA
SABOR
PCPT
Tyrol
Göteborg rounds 2 to 6
ProtecT
Rotterdam rounds 2 to 3
Rotterdam round 1
Göteborg round 1
Tarn
Cleveland Clinic
Durham VA
SABOR
PCPT
Tyrol
Göteborg rounds 2 to 6
ProtecT
Rotterdam rounds 2 to 3
Rotterdam round 1
Göteborg round 1
Tarn
Comment in
-
Prostate cancer: Risk stratification of PSA-based screening.Nat Rev Urol. 2010 Dec;7(12):643. doi: 10.1038/nrurol.2010.192. Nat Rev Urol. 2010. PMID: 21188769 No abstract available.
-
Re: the relationship between prostate-specific antigen and prostate cancer risk: the prostate biopsy collaborative group.J Urol. 2011 Jan;185(1):140. doi: 10.1016/S0022-5347(11)60114-6. J Urol. 2011. PMID: 22082919 No abstract available.
References
-
- Stamey TA, Caldwell M, McNeal JE, et al. The prostate specific antigen era in the United States is over for prostate cancer: what happened in the last 20 years? J Urol. 2004;172:1297–1301. - PubMed
-
- Thompson IM, Ankerst DP, Chi C, et al. Operating characteristics of prostate-specific antigen in men with an initial PSA level of 3.0 ng/ml or lower. Jama. 2005;294:66–70. - PubMed
-
- Schroder FH, Bangma CH, Roobol MJ. Is it necessary to detect all prostate cancers in men with serum PSA levels <3.0 ng/ml? A comparison of biopsy results of PCPT and outcome-related information from ERSPC. Eur Urol. 2008;53:901–908. - PubMed
-
- Schroder F, Kattan MW. The comparability of models for predicting the risk of a positive prostate biopsy with prostate-specific antigen alone: a systematic review. Eur Urol. 2008;54:274–290. - PubMed
-
- Schroder FH, Hugosson J, Roobol MJ, et al. Screening and prostate-cancer mortality in a randomized European study. N Engl J Med. 2009;360:1320–1328. - PubMed
Publication types
MeSH terms
Substances
Grants and funding
LinkOut - more resources
Full Text Sources
Other Literature Sources
Medical
Research Materials
Miscellaneous
