. 2010 Sep 14;107(37):16384-9.
doi: 10.1073/pnas.1007926107. Epub 2010 Aug 24.

Translationally controlled tumor protein is a conserved mitotic growth integrator in animals and plants

Affiliations

Translationally controlled tumor protein is a conserved mitotic growth integrator in animals and plants

Florian Brioudes et al. Proc Natl Acad Sci U S A. .

Abstract

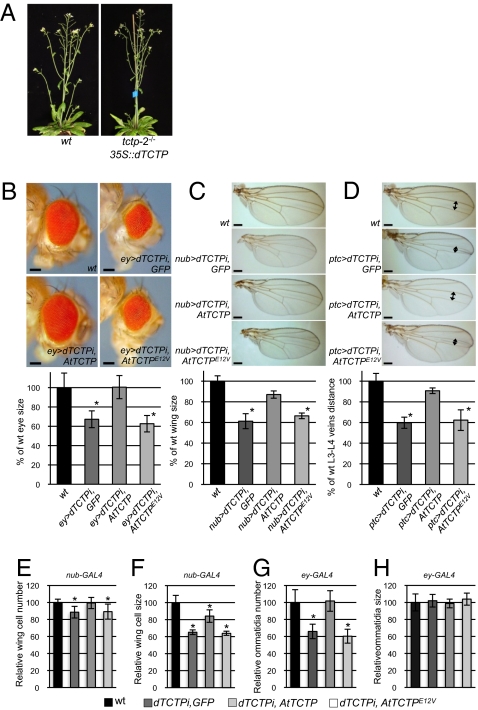
The growth of an organism and its size determination require the tight regulation of cell proliferation and cell growth. However, the mechanisms and regulatory networks that control and integrate these processes remain poorly understood. Here, we address the biological role of Arabidopsis translationally controlled tumor protein (AtTCTP) and test its shared functions in animals and plants. The data support a role of plant AtTCTP as a positive regulator of mitotic growth by specifically controlling the duration of the cell cycle. We show that, in contrast to animal TCTP, plant AtTCTP is not implicated in regulating postmitotic growth. Consistent with this finding, plant AtTCTP can fully rescue cell proliferation defects in Drosophila loss of function for dTCTP. Furthermore, Drosophila dTCTP is able to fully rescue cell proliferation defects in Arabidopsis tctp knockouts. Our data provide evidence that TCTP function in regulating cell division is part of a conserved growth regulatory pathway shared between plants and animals. The study also suggests that, although the cell division machinery is shared in all multicellular organisms to control growth, cell expansion can be uncoupled from cell division in plants but not in animals.


Conflict of interest statement

The authors declare no conflict of interest.

Figures

Fig. 1.
Fig. 1.
Loss of function of AtTCTP results in delayed embryo development. (A) Siliques produced by WT or by heterozygous AtTCTP/tctp-1 and AtTCTP/tctp-2 plants. Arrows indicate tctp homozygous seeds. These seeds were white in color and segregated at a 3:1 ratio [χ2(3:1) = 1.03, P > 0.3 for tctp-1 and χ2(3:1) = 0.90, P > 0.3 for tctp-2]. (B) Embryos from white homozygous tctp-1 and tctp-2 seeds show delayed development compared with embryos of the same age from WT seeds. Developmental stages of WT embryo are denoted as “heart”, “torpedo,” and “cotyledons”. [Scale bars, 50 μm (heart stage) and 100 μm (torpedo and cotyledons stages).]
Fig. 2.
Fig. 2.
Embryos homozygous for tctp-1 or tctp-2 mutations can be rescued by supplying nutrients in vitro. (A) Homozygous tctp-1 and tctp-2 embryos rescued by nutrient supplements in vitro develop into adult plants. WT plant development is used as a control. Days after germination are indicated as 5 d, 10 d, 45 d, 80 d, and 95 d. [Scale bars, 500 μm (5 and 10 d) and 1 cm (45 d).] (B) Semiquantitative RT-PCR analysis showing no expression of AtTCTP in leaves of both tctp-1 and tctp-2 plants. GAPDH was used as control. (C) Western blot analysis of AtTCTP accumulation in leaves of WT, tctp-1, and tctp-2 plants using anti-AtTCTP antibody. No AtTCTP protein accumulation is observed in tctp-1 and tctp-2 plants. Red Ponceau staining of total proteins is shown as control.
Fig. 3.
Fig. 3.
AtTCTP loss of function affects cell division. (A) RNAi-AtTCTP plants exhibit severe dwarf phenotype compared with WT plants. (B) Inflorescence stem cell length measurements show no significant difference in medullar parenchyma cell length between WT and RNAi-AtTCTP (n = 120). (C and D) A significant decrease of leaf epidermal cell density (C) and conical petal cell density (D) is observed in RNAi-AtTCTP plants compared with the WT. Asterisks indicate significant differences with PStudent < 0.001. (E) Surface area measurements of WT and RNAi-AtTCTP petals show no significant change of petal size (n = 30). (FI) Kinematic analysis of leaf growth performed on the first leaf pair of RNAi-AtTCTP and WT. Average of leaf blade area (F), cell area (G), cell numbers (H), and cell division rate (I) are presented. A linear scaled graph of leaf blade area is inserted in F. Note that leaves are twofold smaller in the RNAi-AtTCTP line compared with the WT.
Fig. 4.
Fig. 4.
Plant TCTP controls cell cycle duration (A) Western blot analysis of NtTCTP protein accumulation in WT and RNAi-NtTCTP BY-2 cells using anti-AtTCTP antibody. Coomassie staining of total proteins is shown as control (Bottom). (B) Mitotic index of synchronized WT and RNAi-NtTCTP BY-2 cells after aphidicholin release (AAR). Note the delay and the decrease of the mitotic peak in RNAi-NtTCTP cells compared with WT. (C) Flow cytometric analysis of DNA content in synchronized WT and mutant BY-2 cells. Note the constant G1 population after AAR in RNAi-NtTCTP cells. (D) Quantitative RT-PCR analysis of cell cycle marker genes (PCNA, cyclin A1.1, and cyclin B1.2) and NtTCTP in synchronized WT and mutant BY-2 cells.
Fig. 5.
Fig. 5.
Drosophila dTCTP complements AtTCTP loss of function in Arabidopsis and vice versa. (A) The Drosophila dTCTP (35S::dTCTP) is able to complement embryonic lethality in tctp-2 loss of function mutant. (BD) Arabidopsis AtTCTP is able to complement loss of function of dTCTP in Drosophila. Comparison of eye surface (B), wing surface (C), and L3-L4 veins distance (D) in WT flies and in lines expressing an RNAi directed against dTCTP (dTCTPi) under the control of eyless-GAL4 (B) (ey>), nubbin-GAL4 (C) (nub>), or patch-GAL4 (D) (ptc>) drivers, along with GFP, AtTCTP, or AtTCTPE12V. Asterisks indicate significant differences with pStudent < 0.001; n = 30 for each condition. [Scale bars, 100 μm (B) and 200 μm (C and D).] (E and F) AtTCTP complements cell number defects fully (E) and cell size defects partially (F) in nub > dTCTPi fly wings. (G and H) The eye size reduction in ey > dTCTPi flies is associated with a reduction in ommatidia number (G) but not size (H). The defects in ommatidia number are fully complemented by expressing plant AtTCTP (G). Mutated AtTCTPE12V is unable to complement cell number reduction in wing and ommatidia number reduction in eye of dTCTPi flies. Asterisks indicate significant differences with pStudent < 0.001; n = 30 for each condition.

Similar articles

Cited by

References

    1. Busov VB, Brunner AM, Strauss SH. Genes for control of plant stature and form. New Phytol. 2008;177:589–607. - PubMed
    1. Krizek BA. Making bigger plants: Key regulators of final organ size. Curr Opin Plant Biol. 2009;12:17–22. - PubMed
    1. Conlon I, Raff M. Size control in animal development. Cell. 1999;96:235–244. - PubMed
    1. Bommer UA, Thiele BJ. The translationally controlled tumour protein (TCTP) Int J Biochem Cell Biol. 2004;36:379–385. - PubMed
    1. Hinojosa-Moya J, et al. Phylogenetic and structural analysis of translationally controlled tumor proteins. J Mol Evol. 2008;66:472–483. - PubMed

Publication types

MeSH terms

Substances