. 2010 Oct 15;588(Pt 20):3983-4005.
doi: 10.1113/jphysiol.2010.193300. Epub 2010 Aug 24.

Intravascular pressure augments cerebral arterial constriction by inducing voltage-insensitive Ca2+ waves

Affiliations

Intravascular pressure augments cerebral arterial constriction by inducing voltage-insensitive Ca2+ waves

Rania E Mufti et al. J Physiol. .

Abstract

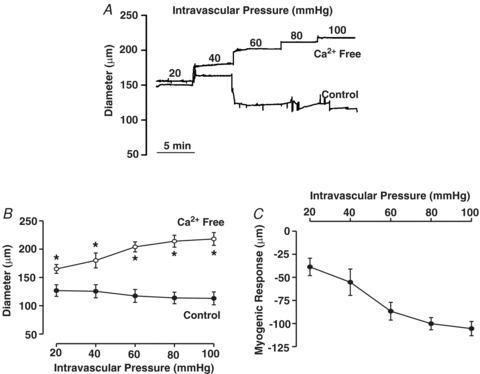
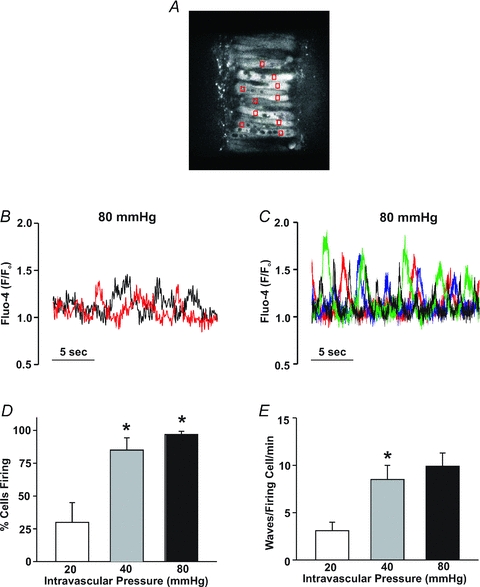
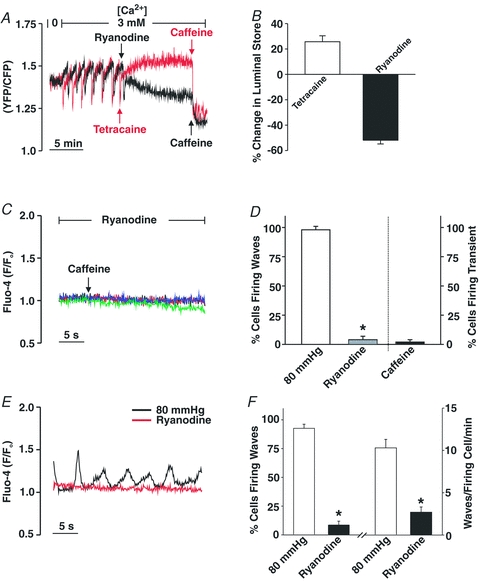
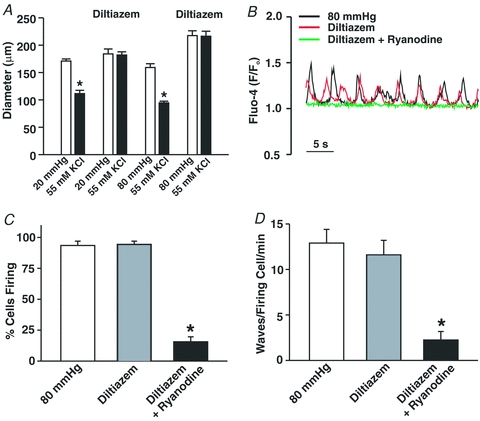
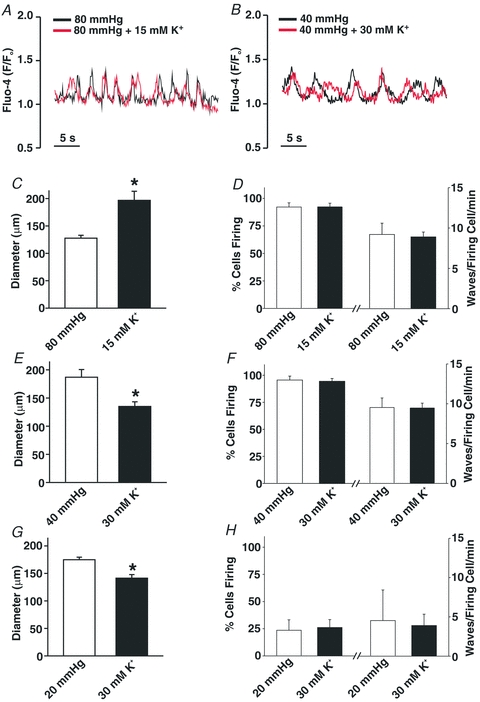
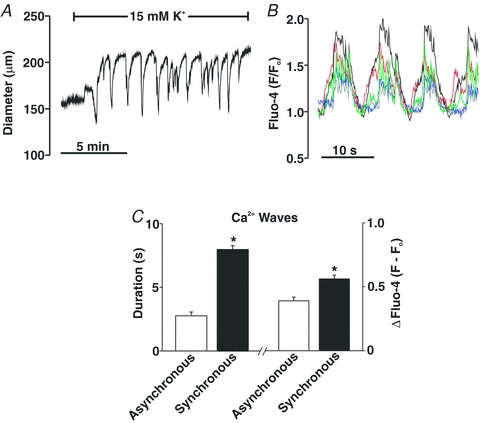
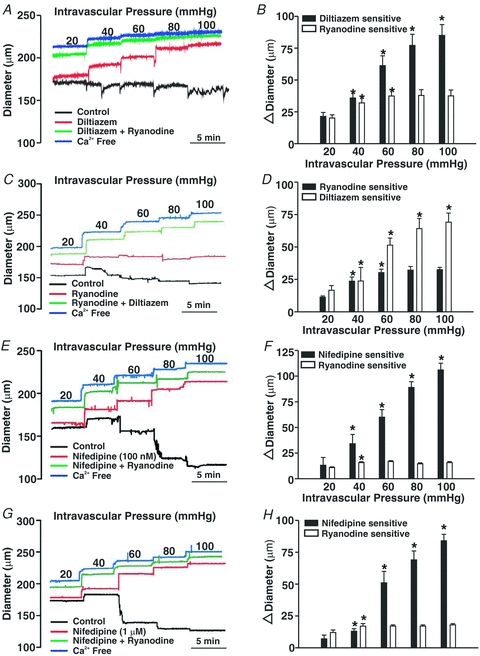
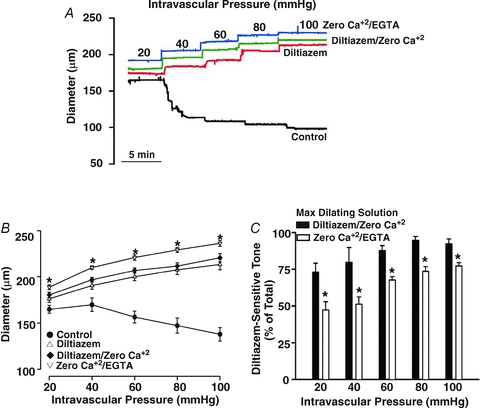
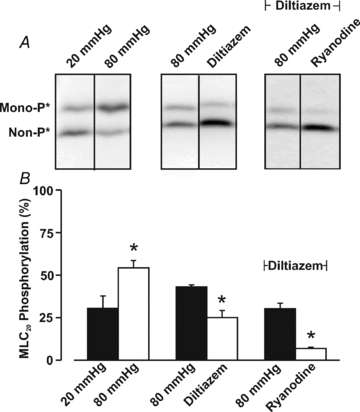
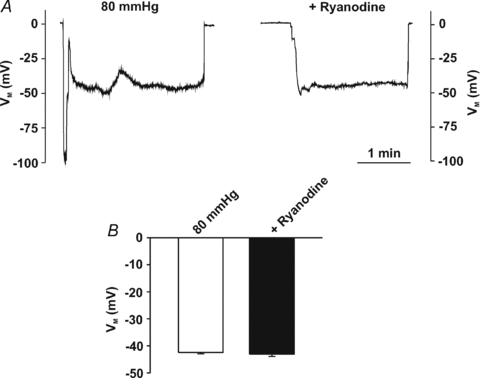
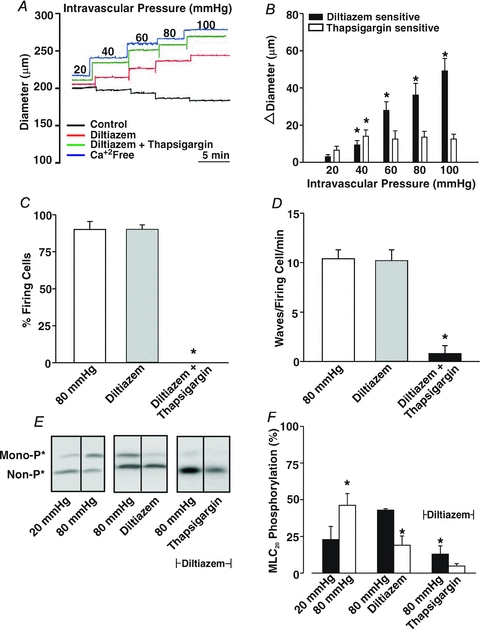
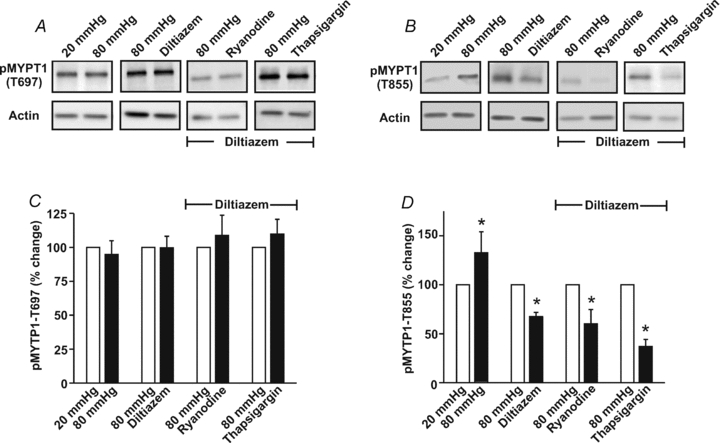
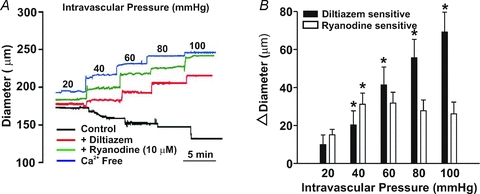
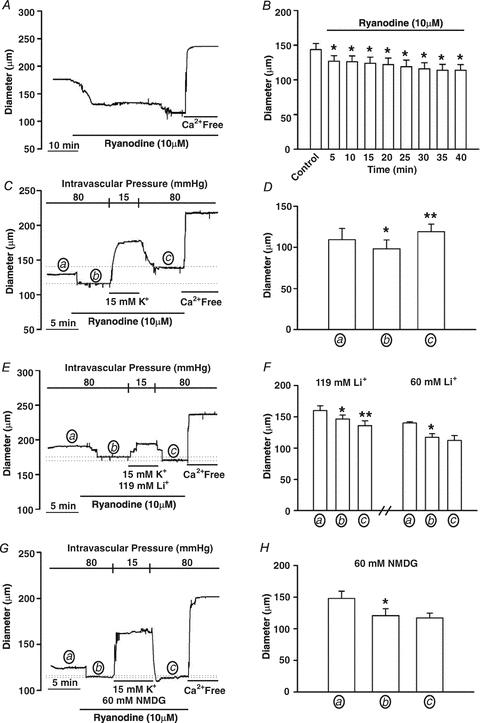
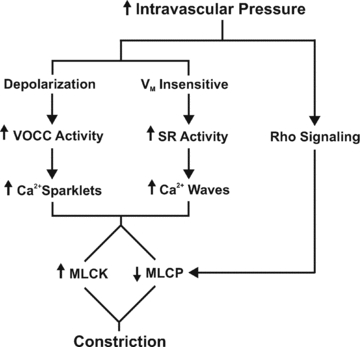
This study examined whether elevated intravascular pressure stimulates asynchronous Ca(2+) waves in cerebral arterial smooth muscle cells and if their generation contributes to myogenic tone development. The endothelium was removed from rat cerebral arteries, which were then mounted in an arteriograph, pressurized (20-100 mmHg) and examined under a variety of experimental conditions. Diameter and membrane potential (V(M)) were monitored using conventional techniques; Ca(2+) wave generation and myosin light chain (MLC(20))/MYPT1 (myosin phosphatase targeting subunit) phosphorylation were assessed by confocal microscopy and Western blot analysis, respectively. Elevating intravascular pressure increased the proportion of smooth muscle cells firing asynchronous Ca(2+) waves as well as event frequency. Ca(2+) wave augmentation occurred primarily at lower intravascular pressures (<60 mmHg) and ryanodine, a plant alkaloid that depletes the sarcoplasmic reticulum (SR) of Ca(2+), eliminated these events. Ca(2+) wave generation was voltage insensitive as Ca(2+) channel blockade and perturbations in extracellular [K(+)] had little effect on measured parameters. Ryanodine-induced inhibition of Ca(2+) waves attenuated myogenic tone and MLC(20) phosphorylation without altering arterial V(M). Thapsigargin, an SR Ca(2+)-ATPase inhibitor also attenuated Ca(2+) waves, pressure-induced constriction and MLC(20) phosphorylation. The SR-driven component of the myogenic response was proportionally greater at lower intravascular pressures and subsequent MYPT1 phosphorylation measures revealed that SR Ca(2+) waves facilitated pressure-induced MLC(20) phosphorylation through mechanisms that include myosin light chain phosphatase inhibition. Cumulatively, our findings show that mechanical stimuli augment Ca(2+) wave generation in arterial smooth muscle and that these transient events facilitate tone development particularly at lower intravascular pressures by providing a proportion of the Ca(2+) required to directly control MLC(20) phosphorylation.


Figures

Figure 1
Figure 1. Elevated intravascular pressure induces myogenic tone in rat cerebral arteries
Posterior cerebral arteries were isolated, cannulated and pressurized between 20 and 100 mmHg. Arterial diameter was measured under control conditions and in Ca2+-free superfusate (zero Ca2++ 2 mm EGTA). Representative tracing (A) and summary data (B and C, n = 8 arteries from 8 animals) of the intravascular pressure response. *denotes significant increase from control.
Figure 2
Figure 2. Ca2+ waves in cerebral arteries
Isolated arteries were loaded with fluo-4, cannulated and pressurized to 20–80 mmHg. A, typical sampling protocol for Ca2+ waves: fluo-4 fluorescence (red boxes) was monitored in 10 successive and visible smooth muscle cells. B, fluo-4 fluorescence, monitored in a single cell but at two separate sites highlights the wave-like nature of the Ca2+ events (i.e. events denoted in the red trace consistently precede events in the black trace). C, fluo-4 fluorescent measured in 4 separate cells illustrates the asynchrony of the Ca2+ waves. D and E, effects of intravascular pressure (n = 8 arteries from 8 animals, 80 cells in total) on the percentage of cells firing Ca2+ waves (D) and on Ca2+ wave frequency (E). *denotes significant increase from the previous pressure step.
Figure 3
Figure 3. The effects of ryanodine on internal Ca2+ store
A and B, HEK-293 cells stably expressing RyR2 and the Ca2+-sensitive FRET-based chameleon protein (D1ER) were perfused with Ca2+-containing buffer while spontaneous luminal Ca2+ oscillations were monitored in the absence or presence of ryanodine (50 μm), tetracaine (1 mm) or caffeine (5 mm). Representative traces and summary data (n = 16 cells) are presented in A and B, respectively. The percentage change in the luminal store was calculated as follows: ((maximal luminal Ca2+ in ryanodine/tetracaine – minimal luminal Ca2+ in caffeine) – (peak luminal Ca2+ during Ca2+ oscillations – minimal luminal Ca2+ in caffeine))/(peak luminal Ca2+ during Ca2+ oscillations – minimal luminal Ca2+ in caffeine). C and D, pressurized cerebral arteries (80 mmHg) were loaded with fluo-4 and sampled for Ca2+ waves/transients in the absence and presence of ryanodine (50 μm) and caffeine (5 mm). Four representative traces of fluo-4 fluorescence are presented in C whereas data summarizing the effects of ryanodine and caffeine on the percentage of cells firing Ca2+ waves/transients are found in D (n = 3 arteries from 3 animals, 30 cells in total). *denotes significant decrease from control (80 mmHg). E and F, cerebral arteries loaded with fluo-4 were pressurized to 80 mmHg and sampled for Ca2+ waves in the absence or presence of ryanodine (50 μm). Representative recording of Ca2+ waves is presented in A whereas data summarizing (n = 6 arteries from 6 animals, 60 cells total) the effects of ryanodine on the percentage of cells firing Ca2+ waves and Ca2+ wave frequency can be found in B. *denotes significant decrease from control (80 mmHg).
Figure 4
Figure 4. The effects of diltiazem on KCl-induced constriction and SR Ca2+ wave generation
A, cerebral arteries pressurized to 20 or 80 mmHg (n = 6 arteries for 5 animals) were exposed to 55 mm KCl in the presence and absence of diltiazem (30 μm, voltage-operated Ca2+ channel inhibitor). B–D, pressurized cerebral arteries loaded with fluo-4 were sampled for Ca2+ waves in the absence and presence of diltiazem (30 μm) ± ryanodine (50 μm). Representative trace and summary data (n = 8 arteries from 8 animals, 80 cells total) highlighting the effects of diltiazem and ryanodine on the percentage of cells firing Ca2+ waves and wave frequency can be found in C and D, respectively. *denotes significant decrease from control (80 mmHg).
Figure 5
Figure 5. Ca2+ wave generation is voltage independent in cerebral arteries
Cerebral arteries were loaded with fluo-4 and pressurized to 40 or 80 mmHg. Vessel diameter and Ca2+ wave generation was assessed under control conditions and in the presence of elevated extracellular [K+] (15 or 30 mm). A, C and D, representative trace (A) and summary data demonstrating the effects of 15 mm extracellular [K+] on resting diameter (C, n = 6 arteries from 5 animals), and on Ca2+ wave generation (D, n = 6 arteries from 6 animals, 60 cells total) as assessed by the percentage of cells firing Ca2+ waves and wave frequency. B, E and F, representative trace (B) and summary data demonstrating the effects of 30 mm extracellular [K+] on resting diameter (E, n = 6 arteries from 6 animals), and on Ca2+ wave generation (F, n = 6 arteries from 6 animals, 60 cells total) as assessed by the percentage of cells firing Ca2+ waves and wave frequency. G and H, summary data demonstrating the effects of 30 mm extracellular [K+] on resting diameter (G, n = 6 arteries from 6 animals) and Ca2+ wave generation (H, n = 5 arteries from 5 animals, 50 cells total) in cerebral arteries pressurized to 20 mmHg. *denotes significant difference from 80, 40 or 20 mmHg.
Figure 6
Figure 6. Elevated extracellular K+ elicits vasomotion and Ca2+ wave synchronization
Cerebral arteries were pressurized to 80 mmHg; arterial diameter and Ca2+ waves were sampled under control conditions and with 15 mM [K+] in the superfusate. A, effect of 15 mm[K+] on arterial diameter. B, effects of 15 mm[K+] on Ca2+ wave synchronization; coloured traces represent changes in fluo-4 fluorescence in different smooth muscle cells within the arterial wall. Arterial vasomotion and Ca2+ wave synchronization was observed in ∼50% of arteries exposed to 15 mm[K+]. C, summary data characterizing the duration and magnitude (F – Fo) of Ca2+ waves that are asynchronous (n = 4 arteries from 4 animals, 17 cells in total) and synchronous (n = 4 arteries from 4 animals, 19 cells in total). *denotes significant increase between the two groups.
Figure 7
Figure 7. The effects of diltiazem, nifedipine and ryanodine on the myogenic response
Cerebral arteries were pressurized from 20 to 100 mmHg while arterial diameter was monitored in the absence and presence of diltiazem (30 μm), nifedipine (100 nm or 1 μm) and/or ryanodine (50 μm). Representative traces and summary data are presented in A, C, E and G and B, D, F and H, respectively. *denotes significant increase from the preceding pressure step. In B, resting and maximal diameters (in μm) were as follows (n = 8 arteries in 8 animals): 20 mmHg, 143 ± 4, 186 ± 3; 40 mmHg, 140 ± 6, 205 ± 4; 60 mmHg, 124 ± 6, 211 ± 4; 80 mmHg, 116 ± 7, 213 ± 4; and 100 mmHg, 113 ± 7, 217 ± 4. In D, resting and maximal diameters (in μm) were as follows (n = 5 arteries from 5 animals): 20 mmHg, 156 ± 4, 188 ± 4; 40 mmHg, 154 ± 4, 205 ± 5; 60 mmHg, 139 ± 5, 215 ± 3; 80 mmHg, 131 ± 5, 218 ± 3; and 100 mmHg, 129 ± 6, 221 ± 3. In F, resting and maximal diameters (in μm) were as follows (n = 6 arteries from 5 animals): 20 mmHg, 174 ± 13, 206 ± 12; 40 mmHg, 169 ± 12, 226 ± 12; 60 mmHg, 154 ± 12, 237 ± 14; 80 mmHg, 137 ± 13, 246 ± 14; and 100 mmHg, 129 ± 12, 253 ± 14. In H, resting and maximal diameters (in μm) were as follows (n = 6 arteries from 6 animals): 20 mmHg, 174 ± 6, 204 ± 5; 40 mmHg, 184 ± 6, 224 ± 7; 60 mmHg, 159 ± 9, 236 ± 7; 80 mmHg, 151 ± 8, 244 ± 7; and 100 mmHg, 145 ± 7, 253 ± 7.
Figure 8
Figure 8. The effects of diltiazem, zero Ca2+ and zero Ca2+/2 mm EGTA on the myogenic response
Cerebral arteries were pressurized from 20 to 100 mmHg while arterial diameter was monitored in the absence and presence of PSS containing diltiazem (30 μm), diltiazem ± zero externally added Ca2+ and zero Ca2+/2 mm EGTA. Representative trace and summary data (n = 5 from 4 animals) are presented in A, and B & C, respectively. In C, diltiazem-sensitive tone was calculated at any given pressure as (diltiazem – control)/(ditiazem/zero Ca2+ or zero Ca2+/2 mm EGTA – control). *denotes significant increase from diltiazem/zero Ca2+.
Figure 9
Figure 9. The effects of diltiazem and ryanodine on MLC20 phosphorylation
Cerebral arteries were pressurized to 20 or 80 mmHg and then exposed to diltiazem (30 μm) + ryanodine (50 μm). Vessels were subsequently frozen in acetone and processed for MLC20 phosphorylation measurements. Representative Western blots and summary data (n = 5 arterial pairs from 5 animals) are presented in A and B, respectively. The molecular mass of the unphosporylated band runs at ∼20 kDa. *denotes significant difference from 20 or 80 mmHg.
Figure 10
Figure 10. Ryanodine does not alter arterial membrane potential (VM)
Cerebral arteries were pressurized (80 mmHg) while VM was monitored in the absence and presence of ryanodine (50 μm). Representative traces (A) and summary data (B, n = 7 arteries from 6 animals) of the effects of ryanodine on arterial VM.
Figure 11
Figure 11. The effects of thapsigargin on the development of myogenic tone
Briefly, cerebral arteries were pressurized between 20 and 100 mmHg while Ca2+ waves, arterial diameter and MLC20 phosphorylation were monitored in the absence and presence of diltiazem (30 μm) and/or thapsigargin (200 nm). Representative illustrations of Ca2+ wave generation, vasomotor responsiveness and MLC20 phosphorylation are presented in A, C and E, respectively. Summary data of vasomotor responsiveness (n = 6 arteries from 6 animals), Ca2+ wave generation (n = 5 arteries from 5 animals, 50 cells in total) and MLC20 phosphorylation (n = 4 arterial pairs from 4 animals) are presented in B, C & D, and F, respectively. *denotes significant difference from diltiazem or ryanodine alone. In A, resting and maximal diameters (in μm) were as follows: 20 mmHg, 160 ± 7, 173 ± 6; 40 mmHg, 162 ± 8, 190 ± 9; 60 mmHg, 158 ± 11, 202 ± 10; 80 mmHg, 148 ± 9, 207 ± 10; and 100 mmHg, 142 ± 10, 215 ± 10.
Figure 12
Figure 12. The effects of diltiazem, ryanodine and thapsigargin on MYPT1 phosphorylation
Cerebral arteries were pressurized to 20 or 80 mmHg and then exposed to diltiazem (30 μm), ryanodine (50 μm) or thapsigargin (200 nm). Vessels were subsequently frozen in acetone and processed for the assessment of MYPT1 phosphorylation at the T697 or T855 site. Representative Western blots are presented in A and B, whereas summary data (n = 4 arterial pairs from 4 animals) can be found in C and D, respectively. Phosphorylated MYPT1 was standardized to actin and then expressed relative to 20 mmHg, 80 mmHg or 80 mmHg + diltiazem. *denotes significant difference from 20 mmHg, 80 mmHg or 80 mmHg + diltiazem.
Figure 13
Figure 13. The effect of 10 μm ryanodine on cerebral arterial tone
A and B, cerebral arteries were pressurized from 20 to 100 mmHg while arterial diameter was monitored in the absence and presence of diltiazem (30 μm) and/or ryanodine (10 μm). All agents were first introduced to arteries resting at 15 mmHg. *denotes significant increase from the preceding pressure step. In B, resting and maximal diameters (in μm, n = 6 arteries from 6 animals) were as follows: 20 mmHg, 155 ± 9, 176 ± 8; 40 mmHg, 145 ± 11, 191 ± 9; 60 mmHg, 125 ± 11, 200 ± 10; 80 mmHg, 111 ± 10, 207 ± 11; and 100 mmHg, 101 ± 11, 213 ± 12.
Figure 14
Figure 14. The effect of Na+/Ca2+ exchange activity on ryanodine-induced tone
A and B, cerebral arteries pressurized to 80 mmHg were exposed to ryanodine (10 μm) and constrictor responses were monitored for 40 min. *denotes significant difference from control. In B, resting and maximal diameters (in μm) at 80 mmHg were 143 ± 9 and 201 ± 12, respectively. C and D, cerebral arteries pressurized to 80 mmHg and exposed to ryanodine (10 μm, 5 min) were hyperpolarized (5 min) by lowering intravascular pressure and exposing tissues to a ryanodine-PSS containing 15 mm extracellular K+. Vessels were then returned to a ryanodine-PSS and repressurized to 80 mmHg. Arterial diameter was assessed at the end of each 5 min period designated by a, b and c. * and **denote significant difference from a or b, respectively. In D, resting and maximal diameters (in μm, n = 6 arteries from 5 animals) at 80 mmHg were 109 ± 13.6 and 189 ± 10, respectively. E–H, the experimental protocol is identical to C and D except that during 5 min hyperpolarization period, the Na+/Ca2+ exchanger was blocked by substituting 119 mm LiCl (n = 6 arteries from 4 animals), 60 mm LiCl (n = 5 arteries from 4 animals) or 60 mm NMDG-Cl (n = 4 arteries from 4 animals) for NaCl. Arterial diameter was assessed at the end of each 5 min period designated by a, b and c. * and **denotes significant difference from a or b, respectively. In D, F and H, resting and maximal diameters (in μm) at 80 mmHg were as follows: D, 160 ± 7 and 227 ± 10, n = 6 from 4 animals; F, 140 ± 2 and 220 ± 9, n = 4 from 4 animals; and H, 148 ± 13 and 209 ± 4, n = 6 from 4 animals.
Figure 15
Figure 15. Illustrative diagram highlighting the mechanism by which elevated intravascular pressure initiates cerebral arterial constriction
VOCC, voltage-operated Ca2+ channels; SR, sarcoplasmic reticulum; MLCK, myosin light chain kinase; and MLCP, myosin light chain phosphatase.

Similar articles

Cited by

References

    1. Adb El-Rahman R, Turner R, Welsh DG. T- and L-type Ca2+ channels contribute to myogenic tone in cerebral arteries. FASEB J. 2010;24:1033.
    1. Akaike N, Kanaide H, Kuga T, Nakamura M, Sadoshima J, Tomoike H. Low-voltage-activated calcium current in rat aorta smooth muscle cells in primary culture. J Physiol. 1989a;416:141–160. - PMC - PubMed
    1. Akaike N, Kostyuk PG, Osipchuk YV. Dihydropyridine-sensitive low-threshold calcium channels in isolated rat hypothalamic neurones. J Physiol. 1989b;412:181–195. - PMC - PubMed
    1. Bayliss WM. On the local reactions of the arterial wall to changes in internal pressure. J Physiol. 1902;28:220–231. - PMC - PubMed
    1. Bers DM. Calcium cycling and signaling in cardiac myocytes. Annu Rev Physiol. 2008;70:23–49. - PubMed

Publication types

MeSH terms