. 2010 Dec 9;116(24):5247-55.
doi: 10.1182/blood-2010-04-280149. Epub 2010 Aug 24.

EZH2-mediated epigenetic silencing in germinal center B cells contributes to proliferation and lymphomagenesis

Affiliations

EZH2-mediated epigenetic silencing in germinal center B cells contributes to proliferation and lymphomagenesis

Irina Velichutina et al. Blood. .

Abstract

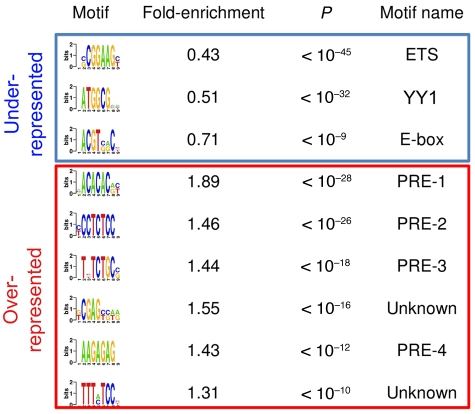
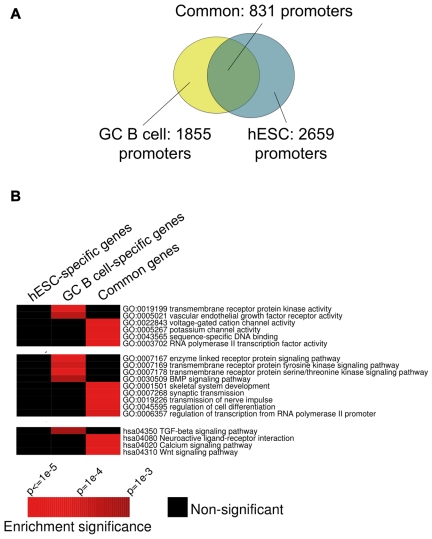
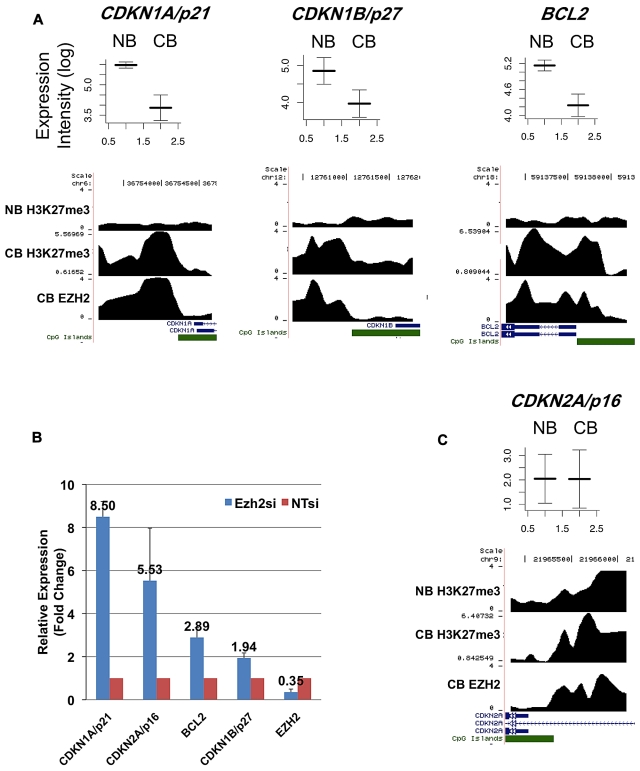
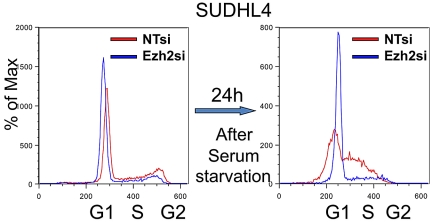
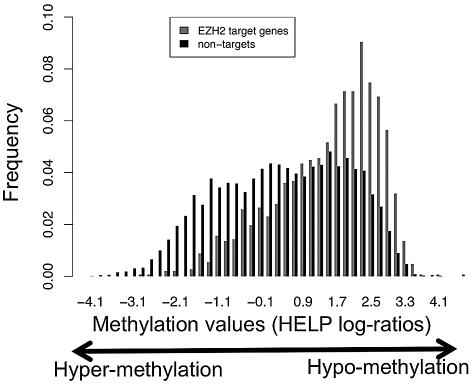
EZH2 is the catalytic subunit of the PRC2 Polycomb complex and mediates transcriptional repression through its histone methyltransferase activity. EZH2 is up-regulated in normal germinal center (GC) B cells and is implicated in lymphomagenesis. To explore the transcriptional programs controlled by EZH2, we performed chromatin immunoprecipitation (ChIP-on-chip) in GC cells and found that it binds approximately 1800 promoters, often associated with DNA sequences similar to Droso-phila Polycomb response elements. While EZH2 targets overlapped extensively between GC B cells and embryonic stem cells, we also observed a large GC-specific EZH2 regulatory program. These genes are preferentially histone 3 lysine 27-trimethylated and repressed in GC B cells and include several key cell cycle-related tumor suppressor genes. Accordingly, siRNA-mediated down-regulation of EZH2 in diffuse large B-cell lymphoma (DLBCL) cells resulted in acute cell cycle arrest at the G(1)/S transition and up-regulation of its tumor suppressor target genes. At the DNA level, EZH2-bound promoters are hypomethylated in GC B cells, but many of them are aberrantly hypermethylated in DLBCL, suggesting disruption of normal epigenetic processes in these cells. EZH2 is thus involved in regulating a specific epigenetic program in normal GCs, including silencing of antiproliferative genes, which may contribute to the malignant transformation of GC B cells into DLBCLs.


Figures

Figure 1
Figure 1
Putative DNA regulatory sequences enriched in and depleted from promoters bound by EZH2 binding in GC B cells. The first column shows the DNA motifs discovered by FIRE as underrepresented (top 3 motifs) and overrepresented (remaining motifs) in EZH2-bound promoters. The second column indicates the fold over/underrepresentation of each motif in EZH2-bound promoters versus nonbound promoters. The third column shows enrichment and depletion P values, calculated using the hypergeometric distribution. The last column shows motif names, when they could be identified using DNA motif databases such as TRANSFAC or JASPAR. PRE-like sequences were identified based on their similarity to Drosophila PREs.
Figure 2
Figure 2
Comparing the GC B-cell and hESC EZH2 regulons. (A) Overlap between sets of promoters targeted by EZH2 in GC B cells (yellow) and hESCs (turquoise). EZH2 target promoters in GC B cells were obtained from 4 ChIP-chip replicate experiments. FDR (10%) was used as threshold in each replicate, and only statistically significant peaks observed in > 50% of 4 replicates were retained; see Methods for details. EZH2 target promoters in hESCs were obtained from a published ChIP-seq study. (B) Certain processes, pathways, and biochemical functions from the Gene Ontology and KEGG databases are specifically enriched in GC B-cell or common EZH2 target genes. In these heatmaps, rows correspond to pathways and biochemical functions, while columns correspond to gene sets targeted by EZH2 in distinct cell types. Red entries in the heatmap correspond to significant (P < .01) enrichment of specific pathways/functions. Black entries indicate no significant enrichment. Enrichment P values were calculated using the hypergeometric distribution.
Figure 3
Figure 3
Representative genes from 2 classes of EZH2 targets. (A) This figure shows mRNA expression values in NBCs (NB) and centroblasts (CB) (from microarray analyses) and EZH2 binding and H3K27me3 ChIP intensity profiles across probeset-covered regions for 3 genes. In the expression plots (top portion), the y-axis corresponds to log-transformed intensity values from microarray experiments. The x-axis correspond to NB and CB. Expression intensities from 5 CB and 5 NB microarray profiles were used to draw these figures, where both average intensities and standard error (error bars) are shown. In the binding profiles, the x-axis corresponds to genomic position around the transcription start site of the considered genes. RefSeq genes overlapping with the covered regions are shown in blue. CpG islands are shown in green. The y-axis corresponds to smoothed and log-transformed ChIP intensities. The figure shows that CDKN1A/p21, CDKN1B/p27, and BCL2 are not marked by H3K27me3 in NB, and become bound by EZH2 in centroblasts and consequently acquire H3K27me3. Accordingly, these 3 genes are down-regulated at the mRNA expression level in centroblasts compared with NBCs. (B) These 3 genes (together with CDKN2A/p16) are up-regulated at the mRNA level (albeit to a different extent) upon siRNA knockdown of EZH2 in SUDHL4 cells, as measured by Q-PCR. In this figure, mRNA expression levels in siRNA-treated cells are normalized with respect to untreated cells (NTsi). Error bars were drawn using data obtained from 3 replicate experiments. (C) This figure shows average expression levels in NB and CB and binding profiles for CDKN2A/p16. The CDKN2A/p16 promoter is associated with H3K27me3 in NB and expressed at low level; in CB, the same gene is associated with EZH2/H3K27me3 and its expression level does not change.
Figure 4
Figure 4
The impact of EZH2 on cell cycle in the SUDHL4 DLBCL cell line. siRNA-mediated EZH2 knockdown in SUDHL4 results in G1/S block and accumulation of cells in S phase. In this experiment, SUDHL4 cells were incubated for 24 hours in complete RPMI medium, followed by a 24-hour incubation in serum-free medium. Starved cells were released into complete medium, and cell cycle progression was measured in 24 hours. The extent of the S phase arrest was measured by FACS using propidium iodide staining. Cell cycle was monitored using FACS 24 hours in serum-starved SUDHL4 cells and 24 hours after reentry.
Figure 5
Figure 5
EZH2 target promoters are less DNA-methylated than nontargets in GC B cells. This figures shows the distribution of DNA methylation values (HELP log-ratios) for all EZH2 target promoters (red) and nontargets (black) represented on our HELP arrays. The HELP assay was performed from tonsil DNA from 8 healthy patients as described previously and using a high density oligonucleotide microarray representing 50 000 CpGs across approximately 14 000 promoters. Methylation profiles for the 8 patients were averaged out. Importantly, in HELP, higher and positive HELP log-ratios correspond to lower DNA methylation.

Similar articles

Cited by

References

    1. Cao R, Wang L, Wang H, et al. Role of histone H3 lysine 27 methylation in Polycomb-group silencing. Science. 2002;298(5595):1039–1043. - PubMed
    1. Muller J, Hart CM, Francis NJ, et al. Histone methyltransferase activity of a Drosophila Polycomb group repressor complex. Cell. 2002;111(2):197–208. - PubMed
    1. Czermin B, Melfi R, McCabe D, Seitz V, Imhof A, Pirrotta V. Drosophila enhancer of Zeste/ESC complexes have a histone H3 methyltransferase activity that marks chromosomal Polycomb sites. Cell. 2002;111(2):185–196. - PubMed
    1. Francis NJ, Saurin AJ, Shao Z, Kingston RE. Reconstitution of a functional core polycomb repressive complex. Mol Cell. 2001;8(3):545–556. - PubMed
    1. Shao Z, Raible F, Mollaaghababa R, et al. Stabilization of chromatin structure by PRC1, a Polycomb complex. Cell. 1999;98(1):37–46. - PubMed

Publication types

MeSH terms

Substances