

Protease-activated receptors mediate crosstalk between coagulation and fibrinolysis
- PMID: 20736455
- PMCID: PMC3012597
- DOI: 10.1182/blood-2010-06-293126
Protease-activated receptors mediate crosstalk between coagulation and fibrinolysis
Abstract
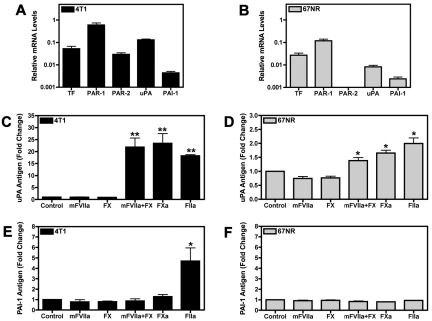
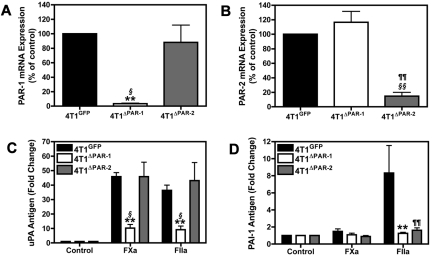
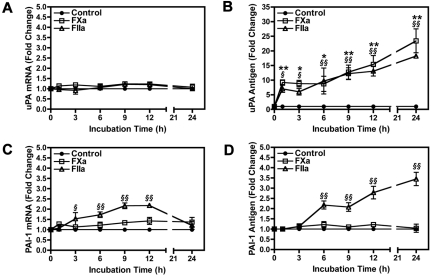
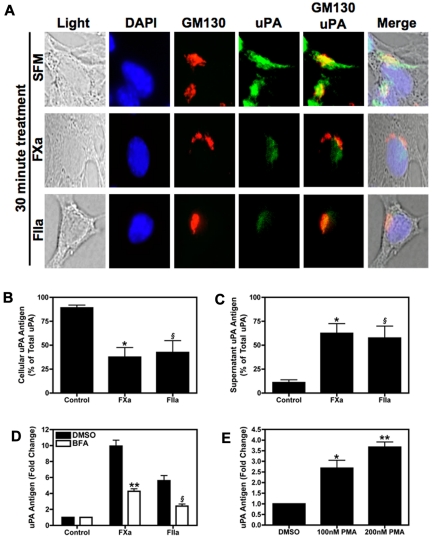
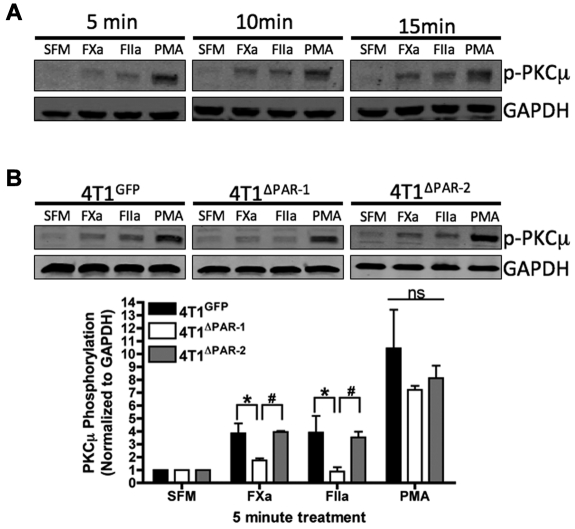
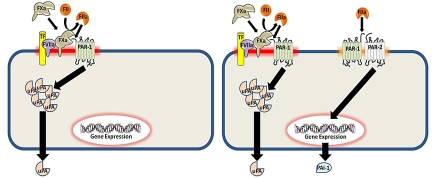
The coagulation and fibrinolytic systems contribute to malignancy by increasing angiogenesis, tumor growth, tumor invasion, and tumor metastasis. Oncogenic transformation increases the expression of tissue factor (TF) that results in local generation of coagulation proteases and activation of protease-activated receptor (PAR)-1 and PAR-2. We compared the PAR-dependent expression of urokinase plasminogen activator (uPA) and plasminogen activator inhibitor (PAI)-1 in 2 murine mammary adencocarcinoma cell lines: metastatic 4T1 cells and nonmetastatic 67NR cells. 4T1 cells expressed TF, PAR-1 and PAR-2 whereas 67NR cells expressed TF and PAR-1. We also silenced PAR-1 or PAR-2 expression in the 4T1 cells. We discovered 2 distinct mechanisms for PAR-dependent expression of uPA and PAI-1. First, we found that factor Xa or thrombin activation of PAR-1 led to a rapid release of stored intracellular uPA into the culture supernatant. Second, thrombin transactivation of a PAR-1/PAR-2 complex resulted in increases in PAI-1 mRNA and protein expression. Cells lacking PAR-2 failed to express PAI-1 in response to thrombin and factor Xa did not activate the PAR-1/PAR-2 complex. Our results reveal how PAR-1 and PAR-2 on tumor cells mediate crosstalk between coagulation and fibrinolysis.
Figures
Similar articles
-
Coagulation, fibrinolysis, and fibrin deposition in acute lung injury.Crit Care Med. 2003 Apr;31(4 Suppl):S213-20. doi: 10.1097/01.CCM.0000057846.21303.AB. Crit Care Med. 2003. PMID: 12682443 Review.
-
Regulation of thrombin-induced plasminogen activator inhibitor-1 in 4T1 murine breast cancer cells.Blood Coagul Fibrinolysis. 2011 Oct;22(7):576-82. doi: 10.1097/MBC.0b013e3283497647. Blood Coagul Fibrinolysis. 2011. PMID: 21799402
-
Thrombotic characteristics of extracellular vesicles derived from prostate cancer cells.Prostate. 2018 Sep;78(13):953-961. doi: 10.1002/pros.23653. Epub 2018 May 15. Prostate. 2018. PMID: 29761522
-
Prostate cancer cell-derived urokinase-type plasminogen activator contributes to intraosseous tumor growth and bone turnover.Neoplasia. 2008 May;10(5):439-49. doi: 10.1593/neo.08106. Neoplasia. 2008. PMID: 18472961 Free PMC article.
-
Coagulation-associated enhancement of fibrinolytic activity via a neutralization of PAI-1 activity.Semin Thromb Hemost. 2000;26(1):39-42. doi: 10.1055/s-2000-9801. Semin Thromb Hemost. 2000. PMID: 10805280 Review.
Cited by
-
Proteinase-activated receptors (PARs) - focus on receptor-receptor-interactions and their physiological and pathophysiological impact.Cell Commun Signal. 2013 Nov 11;11:86. doi: 10.1186/1478-811X-11-86. Cell Commun Signal. 2013. PMID: 24215724 Free PMC article. Review.
-
PAR1 contributes to influenza A virus pathogenicity in mice.J Clin Invest. 2013 Jan;123(1):206-14. doi: 10.1172/JCI61667. Epub 2012 Dec 3. J Clin Invest. 2013. PMID: 23202729 Free PMC article.
-
Protease-activated receptor (PAR)-2 is required for PAR-1 signalling in pulmonary fibrosis.J Cell Mol Med. 2015 Jun;19(6):1346-56. doi: 10.1111/jcmm.12520. Epub 2015 Feb 16. J Cell Mol Med. 2015. PMID: 25689283 Free PMC article.
-
Characterizing Modulators of Protease-activated Receptors with a Calcium Mobilization Assay Using a Plate Reader.J Vis Exp. 2024 May 24;(207):10.3791/66507. doi: 10.3791/66507. J Vis Exp. 2024. PMID: 38856211 Free PMC article.
-
Pretreatment plasma d-dimer levels as an independent prognostic factor for overall survival among patients with advanced non-small-cell lung cancer.J Int Med Res. 2020 Oct;48(10):300060520962661. doi: 10.1177/0300060520962661. J Int Med Res. 2020. PMID: 33100094 Free PMC article.
References
-
- Magnus N, Garnier D, Rak J. Oncogenic epidermal growth factor receptor upregulates multiple elements of the tissue factor signaling pathway in human glioma cells. Blood. 2010;116(5):815–818. - PubMed
-
- Yu JL, May L, Lhotak V, et al. Oncogenic events regulate tissue factor expression in colorectal cancer cells: implications for tumor progression and angiogenesis. Blood. 2005;105(4):1734–1741. - PubMed
-
- Hembrough TA, Swartz GM, Papathanassiu A, et al. Tissue factor/factor VIIa inhibitors block angiogenesis and tumor growth through a nonhemostatic mechanism. Cancer Res. 2003;63(11):2997–3000. - PubMed
Publication types
MeSH terms
Substances
Grants and funding
LinkOut - more resources
Full Text Sources
Research Materials
Miscellaneous
