

Optical coherence tomography detection of subclinical traumatic cartilage injury
- PMID: 20736798
- PMCID: PMC2967018
- DOI: 10.1097/BOT.0b013e3181f17a3b
Optical coherence tomography detection of subclinical traumatic cartilage injury
Abstract
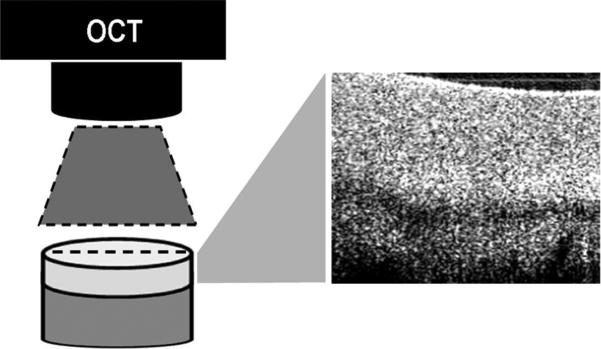
Objectives: Posttraumatic arthritis is a major cause of disability. Current clinical imaging modalities are unable to reliably evaluate articular cartilage damage before surface breakdown, when potentially reversible changes are occurring. Optical coherence tomography (OCT) is a nondestructive imaging technology that can detect degenerative changes in articular cartilage with an intact surface. This study tests the hypothesis that OCT detects acute articular cartilage injury after impact at energy levels resulting in chondrocyte death and microstructural changes, but insufficient to produce macroscopic surface damage.
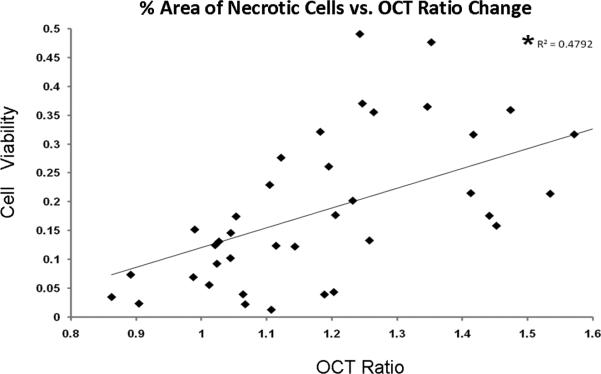
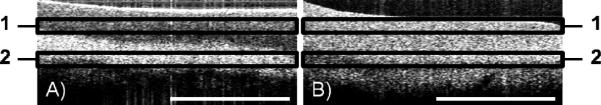
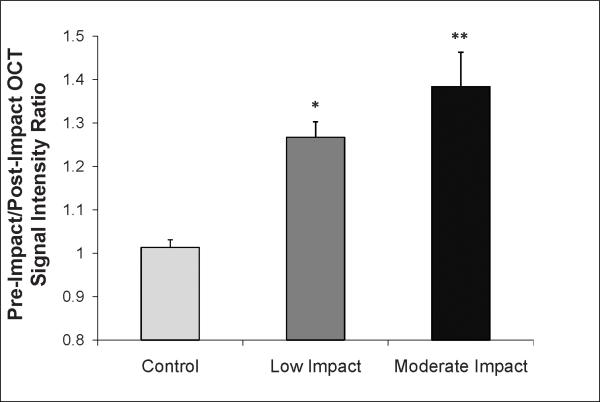
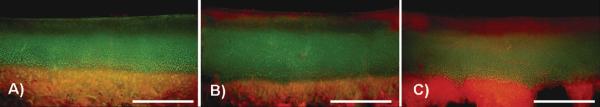
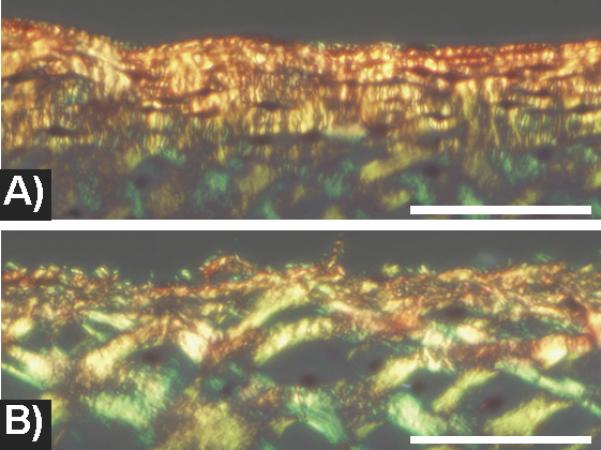
Methods: Bovine osteochondral cores underwent OCT imaging and were divided into a control with no impact or were subjected to low (0.175 J) or moderate (0.35 J) energy impact. Cores were reimaged with OCT after impact and the OCT signal intensity quantified. A ratio of the superficial to deep layer intensities was calculated and compared before and after impact. Chondrocyte viability was determined 1 day after impact followed by histology and polarized microscopy.
Results: Macroscopic changes to the articular surface were not observed after low and moderate impact. The OCT signal intensity ratio demonstrated a 27% increase (P = 0.006) after low impact and a 38% increase (P = 0.001) after moderate impact. Cell death increased by 150% (P < 0.001) and 200% (P < 0.001) after low and moderate energy impacts, respectively. When compared with unimpacted controls, both Mankin histology and David-Vaudey polarized microscopy scores increased (P = 0.036 and P = 0.002, respectively) after moderate energy impact.
Conclusions: This study shows that OCT detects acute cartilage changes after impact injury at levels insufficient to cause visible damage to the articular surface but sufficient to cause chondrocyte death and microscopic matrix damage. This finding supports the use of OCT to detect microstructural subsurface cartilage damage that is poorly visualized with conventional imaging.
Figures
References
-
- Brown TD, Johnston RC, Saltzman CL, et al. Posttraumatic osteoarthritis: a first estimate of incidence, prevalence, and burden of disease. Journal of orthopaedic trauma. 2006;20:739–744. - PubMed
-
- Gelber AC, Hochberg MC, Mead LA, et al. Joint injury in young adults and risk for subsequent knee and hip osteoarthritis. Annals of internal medicine. 2000;133:321–328. - PubMed
-
- Borrelli J, Jr., Tinsley K, Ricci WM, et al. Induction of chondrocyte apoptosis following impact load. Journal of orthopaedic trauma. 2003;17:635–641. - PubMed
-
- Jeffrey JE, Gregory DW, Aspden RM. Matrix damage and chondrocyte viability following a single impact load on articular cartilage. Archives of biochemistry and biophysics. 1995;322:87–96. - PubMed
-
- Natoli RM, Scott CC, Athanasiou KA. Temporal effects of impact on articular cartilage cell death, gene expression, matrix biochemistry, and biomechanics. Annals of biomedical engineering. 2008;36:780–792. - PubMed
Publication types
MeSH terms
Grants and funding
LinkOut - more resources
Full Text Sources
Medical
