. 2011 Feb;31(2):626-39.
doi: 10.1038/jcbfm.2010.136. Epub 2010 Aug 25.

Simultaneous monitoring of tissue PO2 and NADH fluorescence during synaptic stimulation and spreading depression reveals a transient dissociation between oxygen utilization and mitochondrial redox state in rat hippocampal slices

Affiliations

Simultaneous monitoring of tissue PO2 and NADH fluorescence during synaptic stimulation and spreading depression reveals a transient dissociation between oxygen utilization and mitochondrial redox state in rat hippocampal slices

Francesca Galeffi et al. J Cereb Blood Flow Metab. 2011 Feb.

Abstract

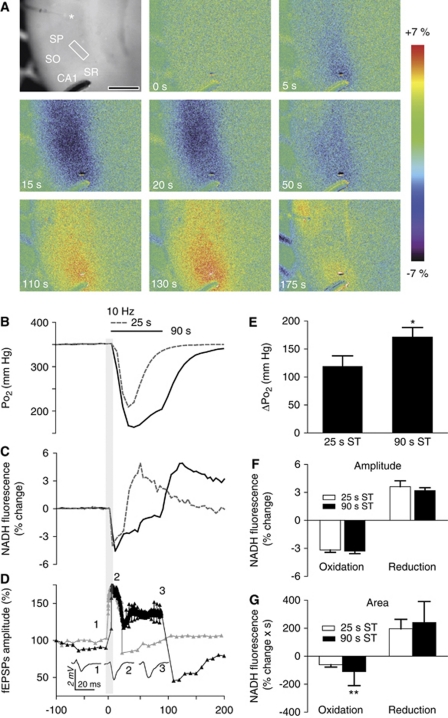
Nicotinamide adenine dinucleotide (NADH) imaging can be used to monitor neuronal activation and ascertain mitochondrial dysfunction, for example during hypoxia. During neuronal stimulation in vitro, NADH normally becomes more oxidized, indicating enhanced oxygen utilization. A subsequent NADH overshoot during activation or on recovery remains controversial and reflects either increased metabolic activity or limited oxygen availability. Tissue P(2) measurements, obtained simultaneously with NADH imaging in area CA1 in hippocampal slices, reveal that during prolonged train stimulation (ST) in 95% O(2), a persistent NADH oxidation is coupled with increased metabolic demand and oxygen utilization, for the duration of the stimulation. However, under conditions of either decreased oxygen supply (ST-50% O(2)) or enhanced metabolic demand (K(+)-induced spreading depression (K(+)-SD) 95% O(2)) the NADH oxidation is brief and the redox balance shifts early toward reduction, leading to a prolonged NADH overshoot. Yet, oxygen utilization remains elevated and is correlated with metabolic demand. Under these conditions, it appears that the rate of NAD(+) reduction may transiently exceed oxidation, to maintain an adequate oxygen flux and ATP production. In contrast, during SD in 50% O(2), the oxygen levels dropped to a point at which oxidative metabolism in the electron transport chain is limited and the rate of utilization declined.


Figures

Figure 1
Figure 1
Simultaneous recording of tissue P2, nicotinamide adenine dinucleotide (NADH) fluorescence, and field excitatory postsynaptic potential (fEPSP) during synaptic train stimulation. (A) The top left shows an unsubtracted camera image of the hippocampal CA1 region. The recording electrode is positioned next to the oxygen sensor, indicated with white asterisk. Scale bar=500 μm. The imaging region of interest (ROI) is positioned in the stratum radiatum between the stimulating and recording electrode. The stratum pyramidale (SP) and the stratum orients (SO) are also indicated. Next are a series of pseudocolor images of NADH fluorescence during and after 90 seconds stimulus train (ST) (10 Hz) in hippocampal slices exposed to 95% O2. The NADH biphasic response consisted of an initial decrease in NADH fluorescence (oxidation) followed by a prolonged fluorescence increase (reduction) at the end of the stimulation. (Below) Traces representative of one experiment of tissue P2 (B), NADH response (C), and fEPSPs amplitude (D), recorded during and after train stimulation. Stimuli were applied for either 25 seconds (gray or dotted line) or 90 seconds (black line). The early decrease in NADH fluorescence reached its minimum within 10 to 15 seconds during both the 25 and 90 seconds trains, whereas NADH fluorescence remained below baseline values for the duration of the stimulus. The time course of the NADH overshoot was dependent on the stimulus duration. Traces in the insert in the lower left show examples of fEPSP, during 90 seconds train stimulation, taken at the times indicated by the numbers on the graphs. (E) Data summary of the peak amplitudes of tissue P2 response during 25 and 90 seconds train stimulation. After 90 seconds stimulation, the tissue P2 response was significantly larger than after 25 seconds (n=8 and 11 for 25 and 90 seconds train stimulation, respectively). (F) Data summary of the peak amplitude of the oxidation and reduction phase of the NADH response. The duration of the stimulation did not affect the peak amplitude of the oxidation and reduction phase (n=7 and 18 for 25 and 90 seconds train stimulation, respectively). (G) Data summary of the area of the changes in NADH fluorescence over time after stimulation. The area of NADH oxidation is expressed as negative area as the NADH fluorescence drops below baseline levels (n=7 and 18 for 25 and 90 seconds train stimulation, respectively). Data are expressed as the mean±s.d.; *P<0.05, **P<0.01, 90 versus 25 seconds train stimulation, unpaired t-test.
Figure 2
Figure 2
Stimulation intensity-dependent changes of tissue P2 and nicotinamide adenine dinucleotide (NADH) biphasic response in the presence of 95% ambient oxygen. (A) Trace representative of one experiment of consecutive tissue P2 responses stimulated with increasing stimulation intensity. Train stimulations of 90 seconds, 10 Hz (black bars), with intensity increasing from 50% to 90% of maximum were delivered approximately every 5 minutes to allow for the recovery. (B) Data summary representing the mean±s.d. of the peak amplitudes of the tissue P2 response. (C) Trace representative of one experiment of consecutive tissue NADH responses. Similar to the tissue P2 response the maximal amplitude of the NADH oxidation phase increased with stimulus intensity. (D) Data summary representing the mean±s.d. of the peak amplitudes of the NADH oxidation phase. (E) The amplitudes of oxidation (filled circles) and reduction (open circles) phases of the NADH responses are plotted against the amplitude of the tissue P2 response. NADH oxidation and oxygen utilization are positively correlated. The NADH fluorescence overshoot and the oxygen response are, however, not significantly correlated. Data are expressed as the mean±s.d.; R=0.989, P<0.01 and R=0.22, P=NS, ΔP2 versus NADH oxidation phase and NADH reduction phase, respectively (n=7). (F) Similar to the amplitude, only the negative area of the NADH oxidation was correlated with increased oxygen utilization. Data are expressed as the mean area ±s.d. R=0.97, P<0.01 and R=−0.32, P=NS, ΔP2 versus NADH oxidation and NADH reduction phase, respectively (n=7).
Figure 3
Figure 3
Tissue P2 and nicotinamide adenine dinucleotide (NADH) responses at various ambient oxygen levels. (A) Changes in baseline NADH fluorescence as a function of the changes in oxygen levels. Traces are the average of two representative experiments. Switching from 95% to 50% O2, results in a drop of baseline tissue P2 levels at the core of the slice. In contrast, the baseline of the NADH fluorescence was not altered after switching ambient oxygen from 95% to 50%. NADH fluorescence starts to increase significantly in 25% O2.(B) Tissue P2 trace of one representative experiment. Train stimulation of 90 seconds (10 Hz) was delivered ∼5 minutes after switching ambient oxygen tension. (C) Normalized tissue P2 and, in slice exposed to 95% O2, are superimposed to responses in 50% O2. Data are expressed as the mean±s.d. (n=6). The profile of the tissue P2 responses was not significantly different in slices exposed to 50% O2 as compared with 95 % O2. (D) Data summary of the peak amplitudes of the tissue P2 response. Data are expressed as the mean±s.d.; P=NS, paired t-test (n=6). (E) Trace of one representative parallel experiment of NADH responses evoked at different ambient oxygen levels. Lowering the oxygen levels caused the NADH/NAD+ ratio to switch toward reduction during stimulation as the oxidation phase was shorter and the NADH overshoot peaked early before the end of the train stimulation. (F) Normalized NADH responses in slice exposed to 95% O2, are superimposed to responses in 50% O2. Data are expressed as the mean±s.d. (n=6). Although the peak amplitudes of both the oxidation and reduction phases of the NADH response were not significantly different in slices exposed to 50% O2, than in 95% O2, but the area of the NADH oxidation (G) was significantly smaller in 50% O2. Data are expressed as the mean±s.d.; **P<0.01, paired t-test (n=6).
Figure 4
Figure 4
The tissue P2 responses were similar near the surface of the slice compared with the center of the slice (nadir). (A) Field excitatory postsynaptic potential (fEPSP) depth profiles, the measurements were taken at 38 μm interval from the surface of the slice to a depth of 212 μm. Note that close to a depth of 100 μm the fEPSP amplitude was 80% of the maximal amplitude. (B) Traces show examples of fEPSP taken at different depths as indicated by the numbers on the graphs. (C) Tissue P2 recording of one representative experiment. The oxygen sensor was placed first at 100 μm, and later lowered deeper into the slice (nadir, ∼200 μm). Synaptic train stimulation (90 seconds, 10 Hz) was applied after at least 5 minutes of stable baseline recording. (D) Data summary of tissue P2 responses recorded at various depths in the hippocampal slice. Data are expressed as the mean±s.d.; P=NS, paired t-test (n=5).
Figure 5
Figure 5
The extreme cellular oxygen demand during K+-induced spreading depression (SD) shifted the mitochondrial redox state toward reduction. (A) The top left shows an unsubtracted camera image of the hippocampal CA1 region. Scale bar=500 μm. In all, 1 mol/L KCl was injected at the subiculum border (white arrow) ∼100 μm deep into the slice, outside the region of interest (ROI) for fluorescence recording. The imaging ROI is positioned in the stratum radiatum between the stimulating and recording electrodes. Next are a series of pseudocolor images of nicotinamide adenine dinucleotide (NADH) fluorescence during a K+-induced SD wave. Numbers on the left of the images correspond to the time (seconds) after the KCl injection. Slices were maintained at 95% O2. The response consisted of a brief decrease in NADH fluorescence (blue signal) that was followed by a prolonged NADH fluorescence increase over baseline values (yellow–red signal). (Right) Recordings of one representative experiment of tissue P2 (B), NADH response (C), V0 (D), and field excitatory postsynaptic potential (fEPSP) (E) during K+-induced SD. The black arrowheads indicate the onset of SD. The trace in the insert in (D) shows the DC shift of the SD wave on an expanded time scale. Note: the NADH fluorescence overshoot peaked while the oxygen tissue level was still depressed.
Figure 6
Figure 6
Comparison of the nicotinamide adenine dinucleotide (NADH) biphasic responses and tissue P2 responses during a K+-induced spreading depression (SD) in 95% and 50 % O2). (A) The amplitude of NADH fluorescence decrease (oxidation) decreased significantly with lower oxygen levels, whereas the NADH overshoot (reduction) was significantly larger. Data are expressed as the mean±s.d.; **P<0.01, unpaired t-test 50% O2 K+-SD versus 95% (n=8 and 5 for K+-SD in 95% and 50% O2, respectively). (B) The duration of the NADH oxidation phase during K+-SD under the two oxygen concentrations was plotted against the duration of the DC shift. Only in the presence of 95% O2 have we found a positive correlation between NADH oxidation and metabolic demand. (R=0.87, P<0.05 and R=−0.6, P=0.2 for K+-SD in 95% and 50% O2, respectively). (C) The rate of oxygen disappearance from the tissue increased as the intensity of the stimulation increased. The rate of oxygen disappearance from the tissue during K+-SD was significantly faster than during synaptic train stimulation, but declined when K+-SD was evoked in 50% ambient oxygen. Data are expressed as the mean±s.d.; **P<0.01, K+-SD 95% O2 versus 90 stimulus train (ST); ###P<0.001 95% O2 versus 50% O2 K+-SD analysis of variance, followed by Tukey's test (n=7 ST 90 ST; n=8 K+-SD in 95% and 5 for K+-SD in 50% O2). (D) The amplitude of the NADH reduction phase was inversely correlated to the rate of oxygen utilization in slices exposed to SD in the presence of 50% ambient oxygen indicating that oxidative metabolism in the mitochondria was limited by a severe drop in tissue oxygen availability (R=−0.89; P<0.05).

Similar articles

Cited by

References

    1. Aitken PG, Tombaugh GC, Turner DA, Somjen GG. Similar propagation of SD and hypoxic SD-like depolarization in rat hippocampus recorded optically and electrically. J Neurophysiol. 1998;80:1514–1521. - PubMed
    1. Aubin JE. Autofluorescence of viable cultured mammalian cells. J Histochem Cytochem. 1979;27:36–43. - PubMed
    1. Buerk DG, Nair P. PtiO2 and CMRO2 changes in cortex and hippocampus of aging gerbil brain. J App Physiol. 1993;74:1723–1728. - PubMed
    1. Cerdán S, Rodrigues TB, Sierra A, Benito M, Fonseca LL, Fonseca CP, García-Martín ML. The redox switch/redox coupling hypothesis. Neurochem Int. 2006;48:523–530. - PubMed
    1. Chance B, Cohen P, Jobsis F, Schoener B. Intracellular oxidation-reduction states in vivo. Science. 1962;137:499–508. - PubMed

Publication types

MeSH terms

LinkOut - more resources