The Abl and Arg non-receptor tyrosine kinases regulate different zones of stress fiber, focal adhesion, and contractile network localization in spreading fibroblasts
- PMID: 20737438
- PMCID: PMC2955401
- DOI: 10.1002/cm.20479
The Abl and Arg non-receptor tyrosine kinases regulate different zones of stress fiber, focal adhesion, and contractile network localization in spreading fibroblasts
Abstract
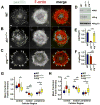
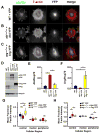
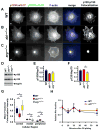
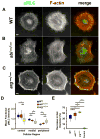
Directed cell migration requires precise spatial control of F-actin-based leading edge protrusion, focal adhesion (FA) dynamics, and actomyosin contractility. In spreading fibroblasts, the Abl family kinases, Abl and Arg, primarily localize to the nucleus and cell periphery, respectively. Here we provide evidence that Abl and Arg exert different spatial regulation on cellular contractile and adhesive structures. Loss of Abl function reduces FA, F-actin, and phosphorylated myosin light chain (pMLC) staining at the cell periphery, shifting the distribution of these elements more to the center of the cell than in wild-type (WT) and arg(-/-) cells. Conversely, loss of Arg function shifts the distribution of these contractile and adhesion elements more to the cell periphery relative to WT and abl(-/-) cells. Abl/Arg-dependent phosphorylation of p190RhoGAP (p190) promotes its binding to p120RasGAP (p120) to form a functional RhoA GTPase inhibitory complex, which attenuates RhoA activity and downstream pMLC and FA formation. p120 and p190 colocalize both in the central region and at the cell periphery in WT cells. This p120:p190 colocalization redistributes to a more peripheral distribution in abl(-/-) cells and to a more centralized distribution in arg(-/-) cells, and these altered distributions can be restored to WT patterns via re-expression of Abl or Arg, respectively. Thus, the altered p120:p190 distribution in the mutant cells correlates inversely with the redistribution in adhesions, actin, and pMLC staining in these cells. Our studies suggest that Abl and Arg exert different spatial regulation on actomyosin contractility and focal adhesions within cells.
© 2010 Wiley-Liss, Inc.
Figures


Similar articles
-
The Abl-related gene tyrosine kinase acts through p190RhoGAP to inhibit actomyosin contractility and regulate focal adhesion dynamics upon adhesion to fibronectin.Mol Biol Cell. 2007 Oct;18(10):3860-72. doi: 10.1091/mbc.e07-01-0075. Epub 2007 Jul 25. Mol Biol Cell. 2007. PMID: 17652459 Free PMC article.
-
Integrin signaling through Arg activates p190RhoGAP by promoting its binding to p120RasGAP and recruitment to the membrane.Mol Biol Cell. 2006 Nov;17(11):4827-36. doi: 10.1091/mbc.e06-02-0132. Epub 2006 Sep 13. Mol Biol Cell. 2006. PMID: 16971514 Free PMC article.
-
Adhesion-dependent regulation of p190RhoGAP in the developing brain by the Abl-related gene tyrosine kinase.Curr Biol. 2004 Apr 20;14(8):691-6. doi: 10.1016/j.cub.2004.03.062. Curr Biol. 2004. PMID: 15084284
-
Regulation of F-actin-dependent processes by the Abl family of tyrosine kinases.J Cell Sci. 2003 Jul 1;116(Pt 13):2613-26. doi: 10.1242/jcs.00622. J Cell Sci. 2003. PMID: 12775773 Review.
-
Actin stress fibres.J Cell Sci. 2007 Oct 15;120(Pt 20):3491-9. doi: 10.1242/jcs.018473. J Cell Sci. 2007. PMID: 17928305 Review.
Cited by
-
Abl2/Arg controls dendritic spine and dendrite arbor stability via distinct cytoskeletal control pathways.J Neurosci. 2013 Jan 30;33(5):1846-57. doi: 10.1523/JNEUROSCI.4284-12.2013. J Neurosci. 2013. PMID: 23365224 Free PMC article.
-
Abl2/Abl-related gene stabilizes actin filaments, stimulates actin branching by actin-related protein 2/3 complex, and promotes actin filament severing by cofilin.J Biol Chem. 2015 Feb 13;290(7):4038-46. doi: 10.1074/jbc.M114.608117. Epub 2014 Dec 24. J Biol Chem. 2015. PMID: 25540195 Free PMC article.
-
Two amino acid residues confer different binding affinities of Abelson family kinase SRC homology 2 domains for phosphorylated cortactin.J Biol Chem. 2014 Jul 11;289(28):19704-13. doi: 10.1074/jbc.M114.556480. Epub 2014 Jun 2. J Biol Chem. 2014. PMID: 24891505 Free PMC article.
-
Targeting Abl kinases to regulate vascular leak during sepsis and acute respiratory distress syndrome.Arterioscler Thromb Vasc Biol. 2015 May;35(5):1071-9. doi: 10.1161/ATVBAHA.115.305085. Epub 2015 Mar 26. Arterioscler Thromb Vasc Biol. 2015. PMID: 25814671 Free PMC article. Review.
-
Genome-wide identification of miR-200 targets reveals a regulatory network controlling cell invasion.EMBO J. 2014 Sep 17;33(18):2040-56. doi: 10.15252/embj.201488641. Epub 2014 Jul 28. EMBO J. 2014. PMID: 25069772 Free PMC article.
References
Publication types
MeSH terms
Substances
Grants and funding
LinkOut - more resources
Full Text Sources
Other Literature Sources
Miscellaneous

