. 2010 Oct 1;518(19):3981-4000.
doi: 10.1002/cne.22436.

Neuronal DNA content variation (DCV) with regional and individual differences in the human brain

Affiliations

Neuronal DNA content variation (DCV) with regional and individual differences in the human brain

Jurjen W Westra et al. J Comp Neurol. .

Abstract

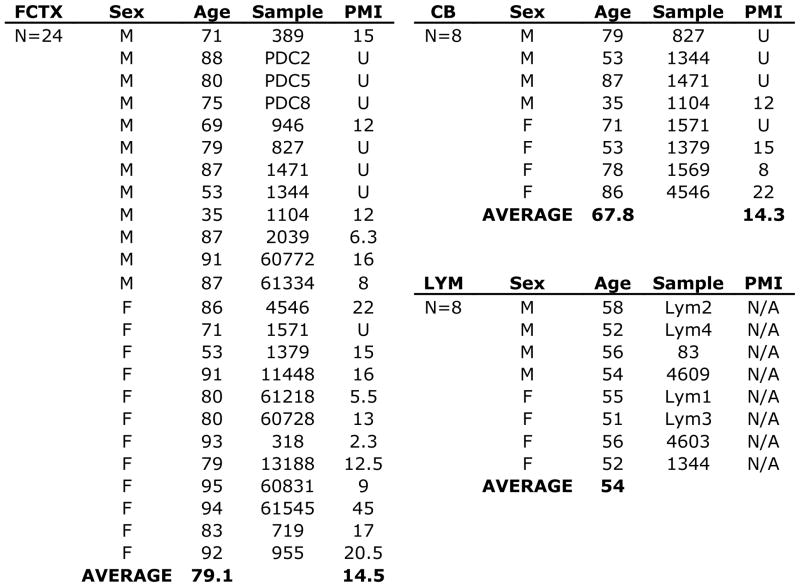
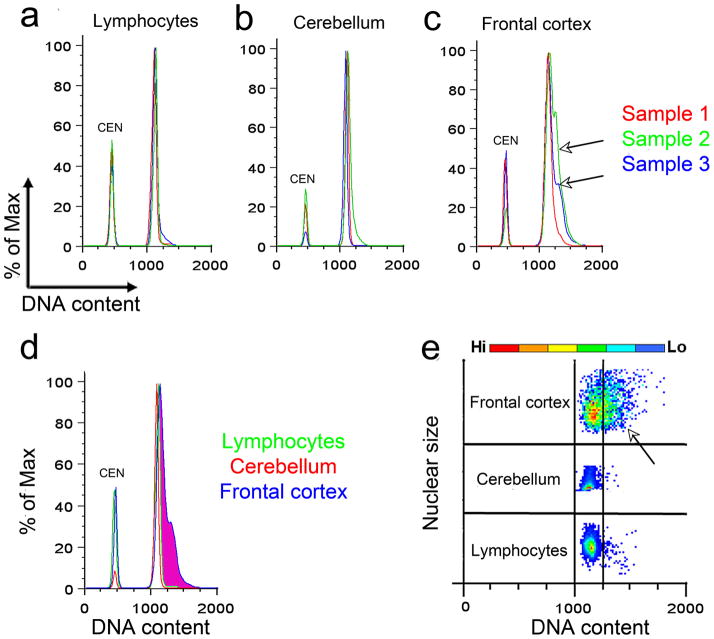
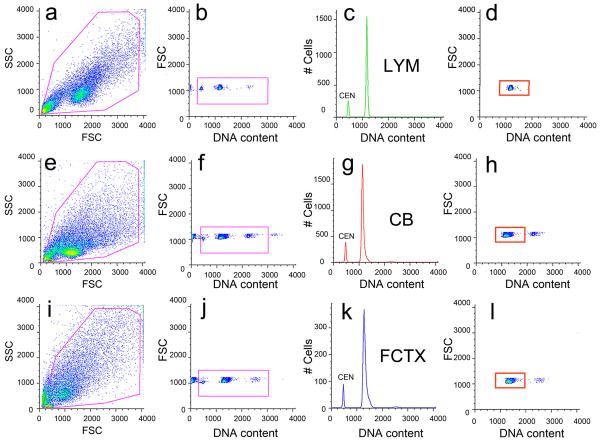
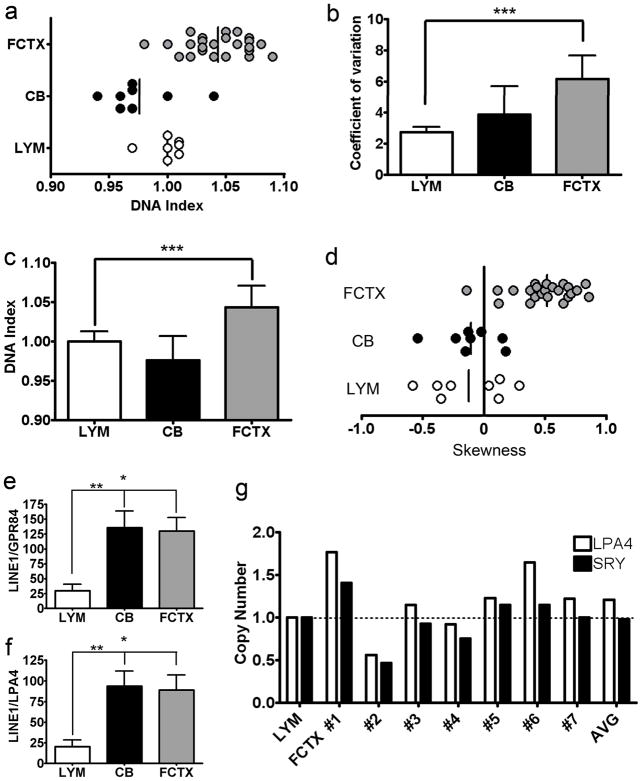
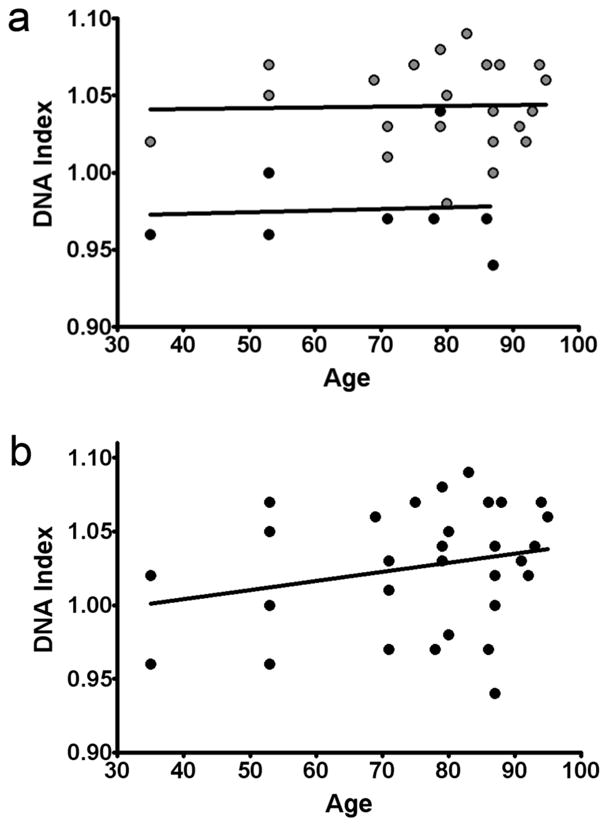
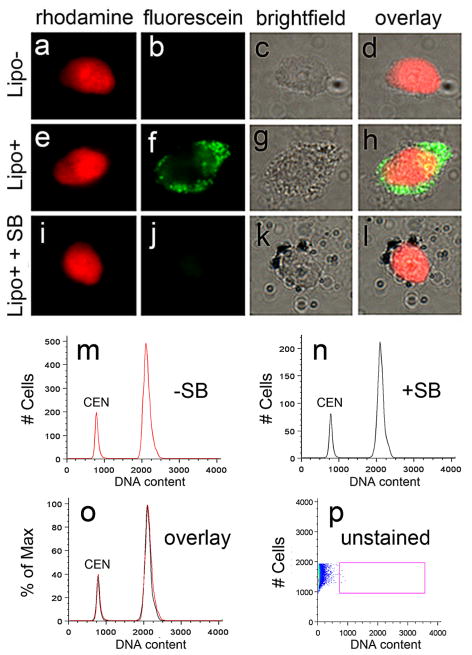
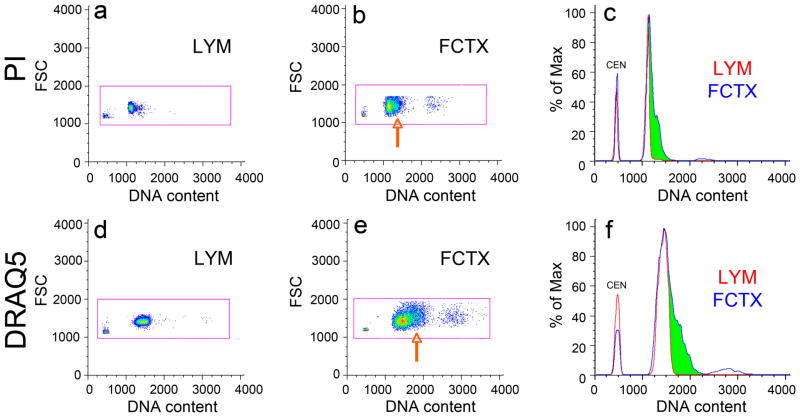
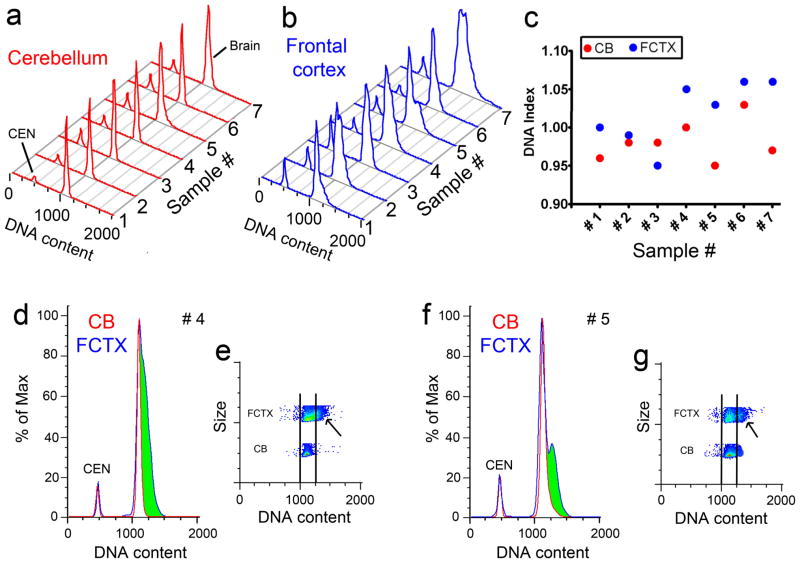
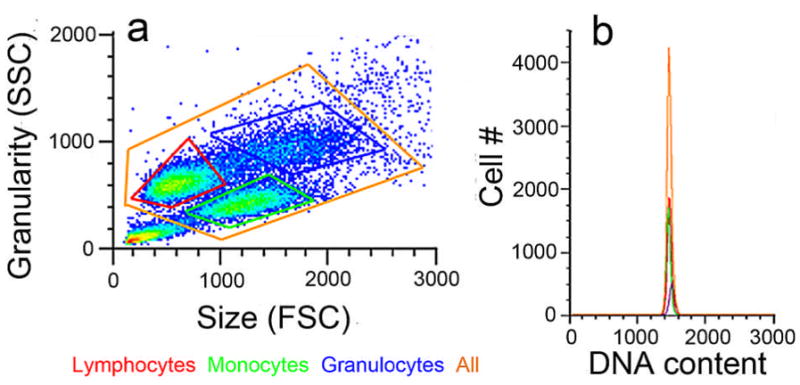
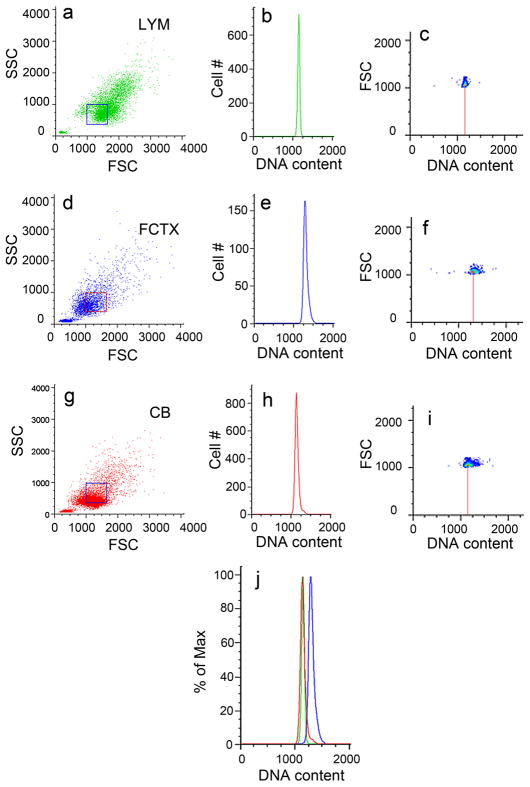
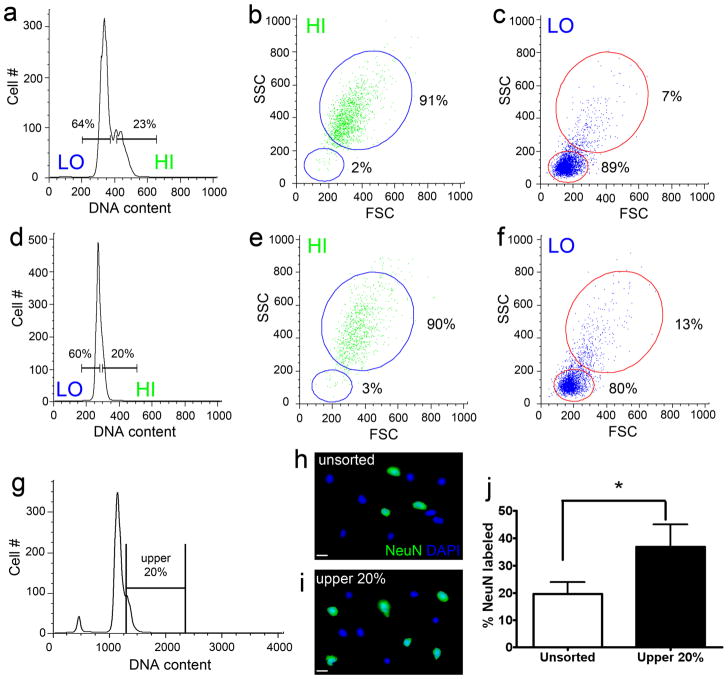
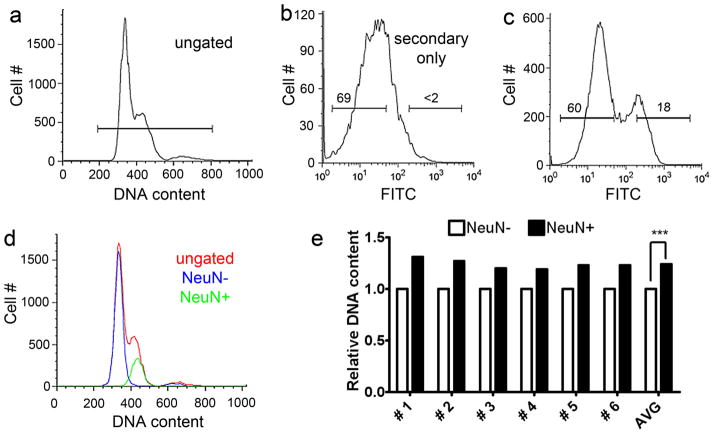
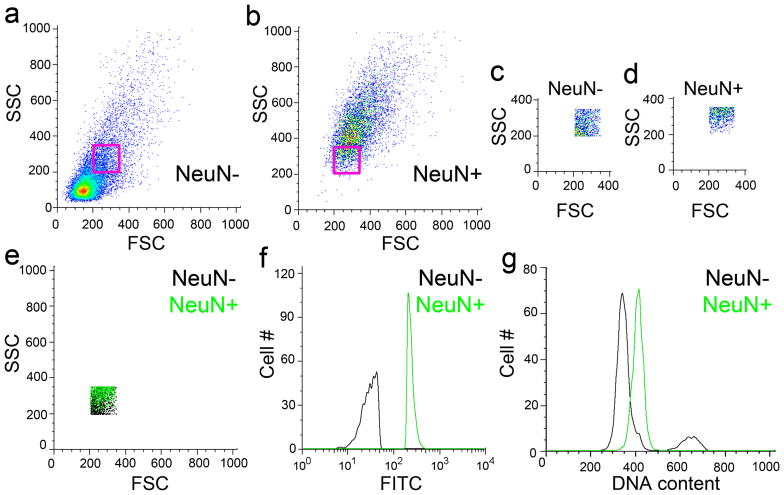
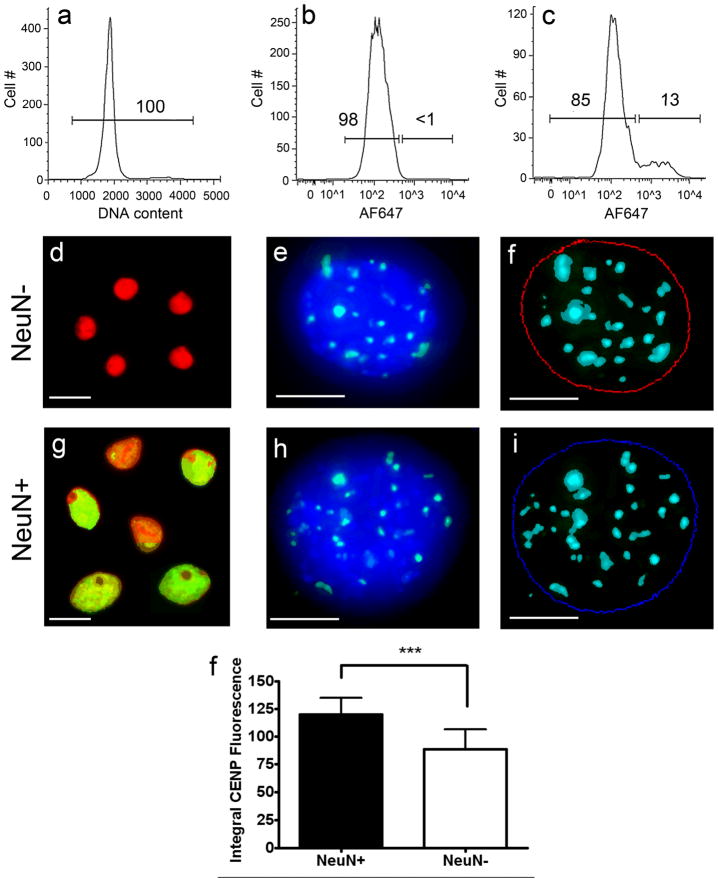
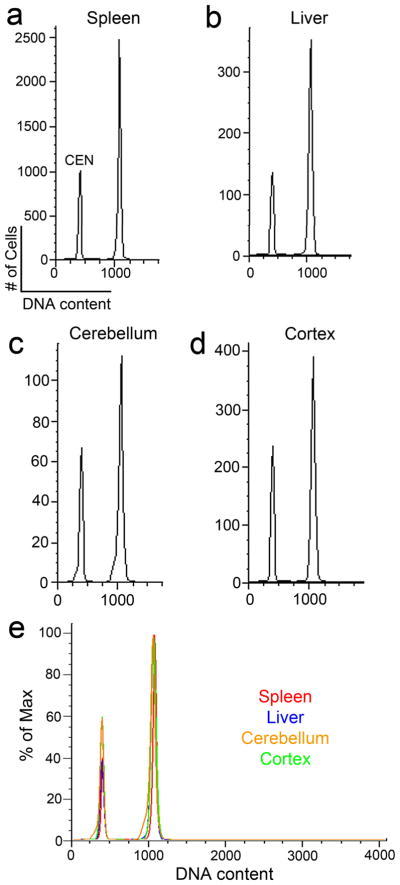
It is widely assumed that the human brain contains genetically identical cells through which postgenomic mechanisms contribute to its enormous diversity and complexity. The relatively recent identification of neural cells throughout the neuraxis showing somatically generated mosaic aneuploidy indicates that the vertebrate brain can be genomically heterogeneous (Rehen et al. [2001] Proc. Natl. Acad. Sci. U. S. A. 98:13361-13366; Rehen et al. [2005] J. Neurosci. 25:2176-2180; Yurov et al. [2007] PLoS ONE:e558; Westra et al. [2008] J. Comp. Neurol. 507:1944-1951). The extent of human neural aneuploidy is currently unknown because of technically limited sample sizes, but is reported to be small (Iourov et al. [2006] Int. Rev. Cytol. 249:143-191). During efforts to interrogate larger cell populations by using DNA content analyses, a surprising result was obtained: human frontal cortex brain cells were found to display "DNA content variation (DCV)" characterized by an increased range of DNA content both in cell populations and within single cells. On average, DNA content increased by approximately 250 megabases, often representing a substantial fraction of cells within a given sample. DCV within individual human brains showed regional variation, with increased prevalence in the frontal cortex and less variation in the cerebellum. Further, DCV varied between individual brains. These results identify DCV as a new feature of the human brain, encompassing and further extending genomic alterations produced by aneuploidy, which may contribute to neural diversity in normal and pathophysiological states, altered functions of normal and disease-linked genes, and differences among individuals.


Figures

Figure 1
Figure 1. Human tissues used in this study
Post-mortem human brain samples from frontal cortex (FCTX) and cerebellum (CB), as well as peripheral blood samples from non-diseased, consenting donors listed by sex (Male, M or Female, F), age, sample identifier, and postmortem interval (PMI). Tissues were obtained from the NICHD Brain and Tissue Bank for Developmental Disorders at the University of Maryland, Baltimore, MD (NICHD contract no. N01-HD-4-3368 and N01-HD-4-3383). The role of the NICHD Brain and Tissue Bank is to distribute tissue, and therefore, cannot endorse the studies performed or the interpretation of results. Additional samples were obtained from Dr. Jeanne Loring at The Scripps Research Institute (TSRI) and the UK Parkinson’s Disease Brain Bank. Human peripheral blood was obtained from the Normal Blood Donor Services at TSRI. Post-mortem human brain samples from frontal cortex (FCTX) and cerebellum (CB), as well as peripheral blood samples from non-diseased, consenting donors listed by sex (Male, M or Female, F), age, sample identifier, and postmortem interval (PMI). Tissues were obtained from the NICHD Brain and Tissue Bank for Developmental Disorders at the University of Maryland, Baltimore, MD (NICHD contract no. N01-HD-4-3368 and N01-HD-4-3383). The role of the NICHD Brain and Tissue Bank is to distribute tissue, and therefore, cannot endorse the studies performed or the interpretation of results. Additional samples were obtained from Dr. Jeanne Loring at The Scripps Research Institute (TSRI) and the UK Parkinson’s Disease Brain Bank. Human peripheral blood was obtained from the Normal Blood Donor Servicesat TSRI.
Figure 2
Figure 2. DNA content analysis of non-diseased human nuclei by flow cytometry
a-c: Representative DNA content histograms from three samples of human lymphocyte (a), cerebellar (b), and human frontal cortical (c) nuclei (red, blue, and green are separate individuals for lymphocytes, cortex, and cerebellum) stained with propidium iodide (PI) and analyzed by FCM. Chicken erythrocyte nuclei (CEN) were included as an internal reference standard and control. Human lymphocytes and cerebellar samples demonstrated homogeneous and qualitatively indistinguishable histograms, while cortical samples displayed heterogeneous histograms with broad right-hand shoulders (lower black arrow, blue cortical histogram in c) and right-hand sub peaks (upper black arrow, green cortical histogram in c). d: Overlay of one representative lymphocyte (green), cerebellar (red), and cortical (blue) histogram identifies an area of increased DNA content uniquely within the cortical sample (magenta). While lymphocytes and cerebellar nuclei histograms were indistinguishable, cortical nuclei always contained populations with increased DNA content and more complex DNA histogram shapes. e: Orthogonal view of the DNA content histograms in which DNA content is plotted against nuclear size identifies the prevalence of nuclei having a given DNA content (prevalence is plotted using a color code where red signifies a large number of nuclei (Hi) and blue signifies a lesser number of nuclei (Lo)) along with scatter. Each scatter plot is only valid for the assessed sample. Vertical black bars serve as local reference lines encompassing expected DNA content for normal cells, beyond which nuclei with increased DNA content can be seen most prominently in the cortical sample (black arrow).
Figure 3
Figure 3. Electronic gating protocol and DNA index calculation for human nuclear samples stained with propidium iodide and analyzed by flow cytometry
Human lymphocyte (a–d, LYM), cerebellar (e–h, CB), and frontal cortical (i–l, FCTX) nuclei were isolated, stained with propidium iodide and treated with RNaseA for a minimum of 90 minutes prior to analysis by FCM. Chicken erythrocyte nuclei (CEN) were included as internal controls to eliminate calibration errors. All nuclei (a,e,i) were gated (magenta boxes throughout figure) on forward scatter (FSC), a measure of nuclear size, and side scatter (Brasseur et al.), a measure of nuclear granularity, to remove nuclei doublets. DNA content was assessed using propidium iodide stained nuclei (b,f,j) to generate DNA content histograms (c,g,k) and orthogonal, top-down histogram views (d,h,l), which plotted nuclear size against DNA content in a pseudo-colored dot plot (blue shades represent few events and red shades indicate the majority of events). Representative gating protocols analyzing lymphocytes (a–d) were repeated for cerebellar (e–h) and cortical (i–l) samples. Mean DNA content values for a ‘diploid’ histogram were obtained from the gate delineated by the orange rectangle in d, h, and l in which only the lymphocyte DNA content is shown. In order to determine DNA index values for each sample, this mean DNA content value was compared to an average of the sex-matched lymphocyte samples to obtain a ratio. For example, if the mean value of male brain sample #1 was 1213 and the mean value for male lymphocytes was 1166, the DNA index for brain sample #1 would be 1213/1166 = 1.04.
Figure 4
Figure 4. Quantitative analysis of DNA content in non-diseased human nuclei
a: Individual DNA indices for human lymphocyte (LYM), cortical (FCTX), and cerebellar (CB) nuclei samples. The DNA index was determined by comparing the mean DNA content value for brain nuclei to the average of the sex-matched lymphocyte samples to obtain a ratio. b: Higher coefficient of variation (CV) values were seen in human cortical samples (6.18 mean, 3.43-9.90 range) compared to cerebellar (3.86 mean, 2.20-6.69 range), and lymphocyte (2.73 mean, 2.20-3.25 range) samples (P < 0.0001). c: Average DI for each sample group (1.0 for lymphocytes, 0.98 for cerebellum, and 1.04 for frontal cortex). The cortical group had a higher mean DI than both lymphocyte and cerebellar sample groups (P = 0.0002). d: Human cortical samples show increased skewness (SKW) values (0.516 mean) compared to lymphocyte (−0.125 mean) and cerebellar samples (−0.106 mean) (P < 0.0001). SKW values were determined by using the formula SKW = mean DNA content mode DNA content/ standard deviation for the ‘diploid’ peak of each sample. Individual cortical samples with high SKW values displayed prominent right histogram shoulders (Fig. 2c). While lymphocytes and cerebella SKW values were near 0 or negative, 23/24 cortical samples had a positive SKW value. e, f: Comparative autoradiography of genomic Southern blots from different, human nuclear populations. Human cortical (N=20) and cerebellar (N=8) genomic DNA samples probed with an L1 repeat element produced a respective 4.4 (P < 0.05) and 4.6-fold (P < 0.01) increase in the ratio of L1 repeat sequences compared to single copy gene (GPR84, Chr. 12) probing of the same DNA samples, contrasting with human lymphocyte DNA (N=7). A similar result was obtained using a different single copy gene (LPAR4, X chromosome). The similar cerebellar and cortical ratios supported a genomic origin for cortical DCV. g: quantitative PCR (QPCR) analysis of sex chromosome loci from human lymphocyte, cerebellar, and cortical genomic DNA. The relative gene copy number of LPAR4 and SRY (on the Y chromosome) was determined from male lymphocytes (set to a value of 1.0 as a reference) and cortices (FCTX #1-7). Relative gene copy numbers of LPAR4 and SRY ranged from 0.47 (SRY in Sample #2) to 1.77 (LPAR4 in Sample #1) in cortical samples, with the average SRY copy number being 0.98, compared to the LPAR4 copy number of 1.25. For panels a–g: * P < 0.05, ** P < 0.01, *** P < 0.001.
Figure 5
Figure 5. The effect of age on the DNA index of human brain samples
a: DNA indices of nuclear samples from human frontal cortex (FCTX, grey dots) and cerebellum (CB, black dots) plotted against age. Linear regression analysis (black lines) revealed no correlation between age and DNA index in the frontal cortex (P = 0.8964 for a non-zero slope) or cerebellum (P = 0.8872 for a non-zero slope). b: DNA index of nuclear samples from human frontal cortex and cerebellum (black dots) plotted against age (the samples shown in b are the same samples as in a, but analyzed as a single group). Linear regression analysis (black line) revealed no correlation between age and DNA index when cortical and cerebellar samples were analyzed as a group (P = 0.1701 for a non-zero slope).
Figure 6
Figure 6. The effect of lipofuscin autofluorescence on human brain DNA content histograms
Lipofuscin is a broad-spectrum autofluorescent pigment seen in both rhodamine and fluorescein microscope channels that accumulates at the nuclear periphery in some aging neurons and might contribute autofluorescent signals in DNA content flow cytometry experiments (Riga and Riga, 1995). This possibility was assessed on nuclei with low lipofuscin (a–d, Lipo-) vs. high lipofuscin (e–h, Lipo+) pigment levels, stained with PI (red); Lipo+ nuclei were visible in a fluorescein channel (green). Autofluorescence from lipofuscin can be minimized with the addition of the lipophilic dye, Sudan Black (i–l, SB), which preferentially binds to lipofuscin granules (black particles in k and l) (Schnell et al., 1999) and quenches the autofluorescent signal, and then is visualized by brightfield microscopy. SB staining was used in initial experiments; however further analyses demonstrated that it was not necessary (m–o), wherein the addition of SB to human brain nuclei prior to FCM did not significantly alter DNA content histograms (SB- (red histogram), SB+ (black histogram), and overlay). Importantly, when unstained isolated nuclei were analyzed by FCM, no signal from lipofucsin alone (p, unstained) was observed in the PI (or DRAQ5, data not shown) channel indicating that the presence of lipofuscin does not contribute to fluorescence signals in DNA content FCM of human brain nuclei. Scale bar = 5 μm in a–l.
Figure 7
Figure 7. The effect of distinct DNA binding dyes on DNA content histograms
Isolated human lymphocyte and cortical nuclei spiked with chicken erythrocyte nuclei (CEN) and stained with the DNA intercalating dye propidium iodide (PI, a–c) or the DNA minor groove binding dye, DRAQ5 (d–f) (Smith et al., 2000), were analyzed by FCM. A similar right-hand shoulder in the frontal cortical sample was seen using both dyes in either an orthogonal, top-down view (orange arrowheads in b and e) or a histogram view (green shading in c and f). Similar results were seen with all other paired samples examined, indicating that similar DCV patterns are seen with distinct DNA binding dyes having different DNA binding characteristics. The identification of cortical DCV with DRAQ5 also further ruled-out any contribution of lipofuscin autofluorescence to DNA content signals, since lipofuscin is minimally fluorescent in the far-red spectra (633 nm) used to excite DRAQ5 (Dowson, 1982).
Figure 8
Figure 8. DNA content analysis of cerebellar and cortical nuclei from the same individuals
Pairwise analysis of DNA content histograms in the same individuals (Samples #1-7, each sample represents a unique individual) from the cerebellum (a: CB, red) vs. frontal cortex (b: FCTX, blue), with CEN included as an internal control. FCM histograms from the cerebellum and cortex of the same individual were non-identical, as shown by broader and more complex peaks in cortical samples. c: In 6 of 7 individuals, the cortical DNA index (red filled circles) was higher than the cerebellar DNA index (blue filled circles). In d–g, examples of non-identity between DNA content histograms from cerebellar (CB, red) and cortical (FCTX, blue) nuclei for individuals #4 (d–e) and #5 (f–g). The cortical sample from individual #4 had a broad peak, with nuclei showing increased DNA content (green shading in d), while the cortical sample in individual #5 showed a prominent sub-peak of nuclei with increased DNA content (green shading in f). An orthogonal view of DNA content plotted against nuclear size as a pseudo-color plot (red represents high nuclei numbers and blue represents low nuclei numbers; see Fig. 2) is shown for cerebellar and cortical samples #4 (e) and #5 (g) with black lines included as DNA content references. In this view, the green right-hand shoulder/sub-populations seen in the classical histogram view are clearly discernable in the cortical samples (black arrows in e and g).
Figure 9
Figure 9. DNA content of leukocyte populations with different physical characteristics
Human leukocytes gated into different populations (a) based on size and granularity (lymphocytes, red; monocytes, green; granulocytes, blue; and all nuclei, orange) show overlapping DNA content histograms (b). These results indicate that nuclear size is independent of DNA content values.
Figure 10
Figure 10. DNA content analysis of similarly sized nuclei from different brain regions and lymphocytes by FCM
Backgated fractions of similarly sized (boxed regions) human nuclei from lymphocytes (green, a–c), frontal cortex (blue, d–f), and cerebellum (red, g–i) stained with propidium iodide and analyzed by FCM. Backgates were drawn from dot plots of nuclear size (FSC) and granularity (Brasseur et al.) in a, d, and g. Lymphocytes and cerebellar nuclei show overlapping DNA content histograms, while similarly sized cortical nuclei show increased DNA content in the orthogonal, top-down views (red vertical line from population mode in c, f, and i) and overlay view (j). These data indicate that nuclear size does not affect DCV.
Figure 11
Figure 11. Backgating analysis and immunolabeling of human cortical nuclei
Histograms with a prominent DCV shoulder (a) or no-shoulder (d) from human cortical nuclei stained with propidium iodide were backgated on the basis of DNA content fluorescence into lower 60% (LO) and upper 20% (HI) fractions. HI and LO fractions were then analyzed for physical nuclear characteristics (plotted as nuclear size (FSC) against nuclear granularity (SSC) (Brasseur et al.)). Backgating analysis of these populations revealed that HI nuclei (b and e) were generally larger and more granular than LO nuclei (c and f) in histograms with shoulders and normal histograms (91% large/high granularity nuclei and 2% small nuclei/low granularity in HI (b) vs. 7% large/high granularity nuclei and 89% small/low granularity nuclei in low (c) for the histogram with a shoulder). Percentages refer to the percent of the backgated nuclei that fall within the large or small nuclear populations. (g) FACS was used to isolate the upper 20% of the nuclei based on DNA content from propidium iodide stained cortical nuclei. (h-i) FACS isolated nuclei were then immunolabeled for the neuronal marker, NeuN (green). The percentage of NeuN immunolabeled nuclei in the upper 20% was 1.9 fold that of the percentage of unsorted nuclei (j: N = 4, P = 0.0101). These results indicate that at the upper end of the DNA content histograms in cortical samples, there are more neurons, which tend to be large and granular. Scale bar = 10 μm in h–i.
Figure 12
Figure 12. DNA content analysis of NeuN immunolabeled nuclei from the non-diseased frontal cortex
a–c: Human brain nuclei were isolated from post-mortem samples, immunolabeled for NeuN and stained with the non-spectrally overlapping DNA dye, DRAQ5. All DRAQ5 positive nuclei (a) were gated on NeuN immunoreactivity (c) and analyzed for DNA content. Gates (horizontal lines in the top 2 histograms) for the NeuN+ and NeuN- populations were determined using nuclei exposed to the secondary antibody alone (b, full gating parameters are shown in Fig. 3). Numbers above the gates represent the percentage of nuclei falling within the gate. NeuN positive nuclei (green histogram in d) had higher DNA contents than NeuN negative nuclei (blue histogram in d), however both histograms fell within the ungated DRAQ5+ population (red histogram in d). Note: A representative example is shown in a–d, N = 6 samples analyzed in total. Quantitative analysis (e) of the DNA content of NeuN+ nuclei compared to NeuN- nuclei for the 6 samples analyzed (NeuN- samples set to 1.0 as a reference), revealed a ~33% increase in DRAQ5 intensity in NeuN+ nuclei (black bars), with every sample showing increased DNA content in neuronal nuclei relative to non-neuronal nuclei (white bars).
Figure 13
Figure 13. Nuclear size and DNA content in NeuN-labeled cortical nuclei
Nuclear fractions of similar size (magenta boxes in a and b) of NeuN negative (a magnified view of the nuclear fraction within the magenta box is shown in c and d for NeuN negative and NeuN positive nuclei, respectively) and NeuN positive (e-g) DRAQ5-stained human cortical nuclei analyzed for NeuN labeling (f) and DNA content (g). Similarly sized nuclei from a and b maintained separation of the NeuN label (FITC in f), while NeuN positive nuclei (green histogram in g) contained more DNA than similarly sized NeuN negative nuclei (black histogram in g). These data argue that even in a population of similarly sized nuclei, neurons contain more genomic DNA than non-neuronal nuclei.
Figure 14
Figure 14. Peptide nucleic acid (PNA) FISH analysis of FACS sorted nuclei
Human cortical nuclei were stained with the DNA dye, propidium iodide (PI), and immunolabeled with the neuronal marker NeuN prior to PNA FISH. NeuN was detected using an Alexa Fluor 647 (AF647) labeled secondary antibody. Using FACS, all PI stained nuclei (a) were sorted into NeuN positive and NeuN negative populations (c) based on the NeuN secondary antibody-alone control (b). Numbers shown on the plots refer to the percent of the nuclei that fall within the gated populations. Purified neuronal (gi) and non-neuronal (df) nuclear populations were subjected to FISH using CENP-B box sequence specific peptide nucleic acid (PNA) probes (green signals in e and h). Z-stack images of each nucleus were acquired using deconvolution microscopy (McNally et al., 1999) and the resulting images were projected to form a pseudo-three dimensional image (e and h). Thresholds for DAPI fluorescence and PNA probe fluorescence were set using MetaMorph analysis software to quantitate integral PNA fluorescence within the DAPI borders of each nucleus (blue and red circles in f and i). A minimum of 30 nuclei were analyzed for NeuN positive and NeuN negative fractions for each of 4 samples. NeuN positive nuclei had a ~36% increase in CENP-B fluorescence relative to NeuN negative nuclei (j, P < 0.0001). These results provide further evidence that the additional DNA seen in neuronal nuclei relative to non-neuronal nuclei by DNA content FCM/FACS, Southern blotting, and QPCR is genomic in origin. Scale bars = 10 μm in d, g and in 5 μm in e, f, h, i. A magenta green version of this figure has been posted as a supplementary file.
Figure 15
Figure 15. DNA content analysis of murine tissues by FCM
Individual DNA content histograms from a representative sample of murine spleen (a), liver (b), cerebellar (c), and frontal cortical (d) nuclei (from the same animal) were stained with propidium iodide and treated with RNaseA prior to FCM. Nuclei were isolated and prepared in a manner similar to the analysis of human nuclei, including the addition of control chicken erythrocyte nuclei (CEN). The color-coded overlay of individual histograms in (a-d) are shown in (e), (red = spleen, blue = liver, orange = cerebellum, and green = cortex). Of note is the relative homogeneity in DNA content from the murine brain compared to the DCV found in the human brain.

Similar articles

Cited by

References

    1. Aldhous MC, Raab GM, Doherty KV, Mok JY, Bird AG, Froebel KS. Age-related ranges of memory, activation, and cytotoxic markers on CD4 and CD8 cells in children. Journal of clinical immunology. 1994;14(5):289–298. - PubMed
    1. Bergers E, van Diest PJ, Baak JP. Tumour heterogeneity of DNA cell cycle variables in breast cancer measured by flow cytometry. Journal of clinical pathology. 1996;49(11):931–937. - PMC - PubMed
    1. Bhardwaj RD, Curtis MA, Spalding KL, Buchholz BA, Fink D, Bjork-Eriksson T, Nordborg C, Gage FH, Druid H, Eriksson PS, Frisen J. Neocortical neurogenesis in humans is restricted to development. Proceedings of the National Academy of Sciences of the United States of America. 2006;103(33):12564–12568. - PMC - PubMed
    1. Brasseur R, de Kruijff B, Ruysschaert JM. Mode of organization of lipid aggregates: a conformational analysis. Biosci Rep. 1984;4(3):259–267. - PubMed
    1. Bruner JM, Langford LA, Fuller GN. Neuropathology, cell biology, and newer diagnostic methods. Current opinion in oncology. 1993;5(3):441–449. - PubMed

Publication types