. 2010 Aug:1204:43-53.
doi: 10.1111/j.1749-6632.2010.05527.x.

Do women stop early? Similarities in fertility decline in humans and chimpanzees

Affiliations

Do women stop early? Similarities in fertility decline in humans and chimpanzees

Kristen Hawkes et al. Ann N Y Acad Sci. 2010 Aug.

Abstract

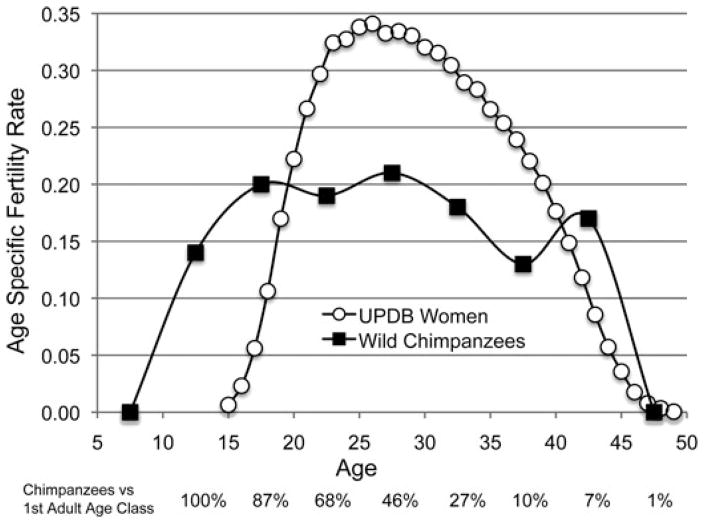
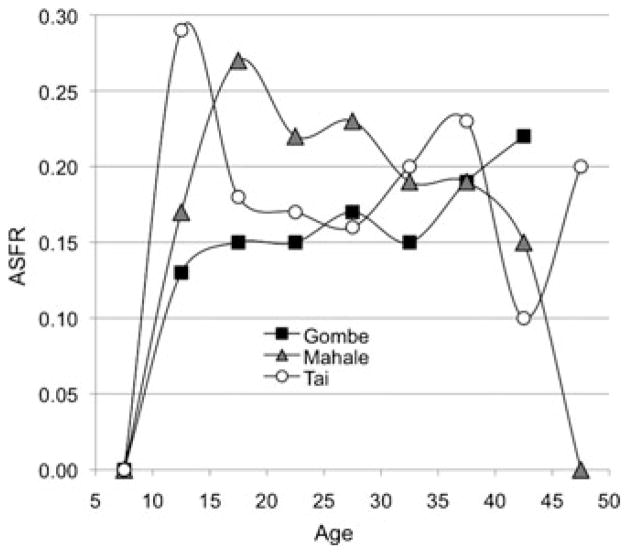
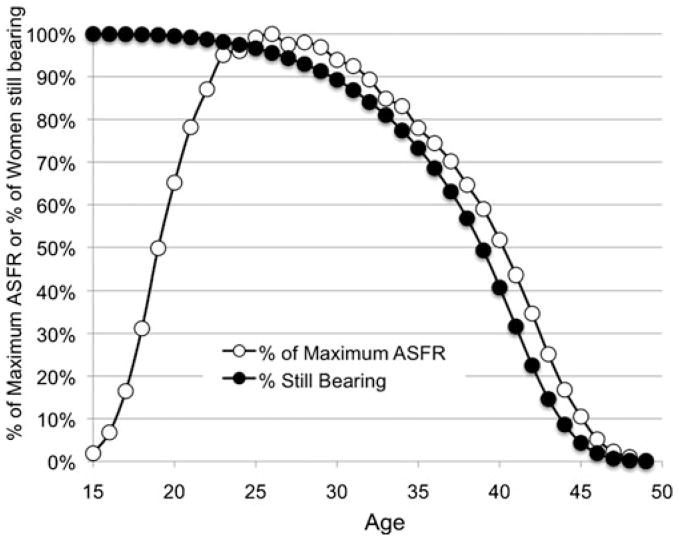
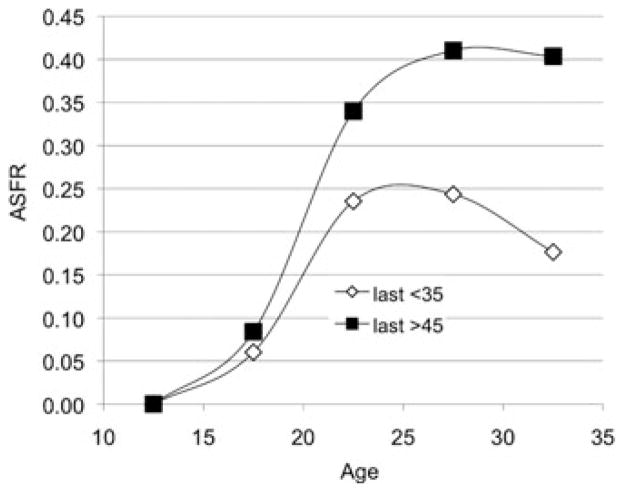
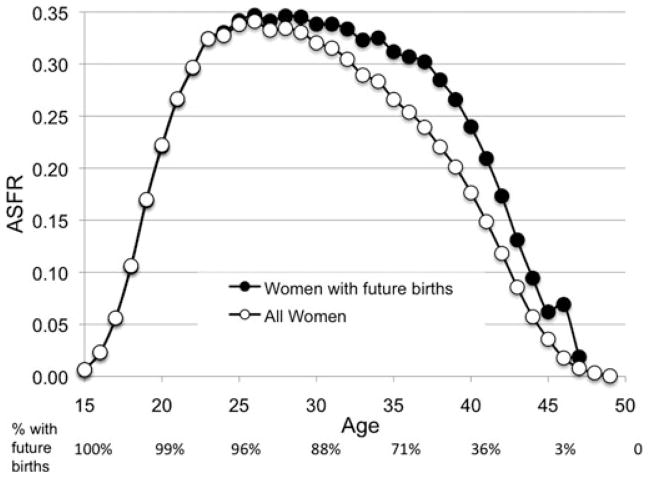
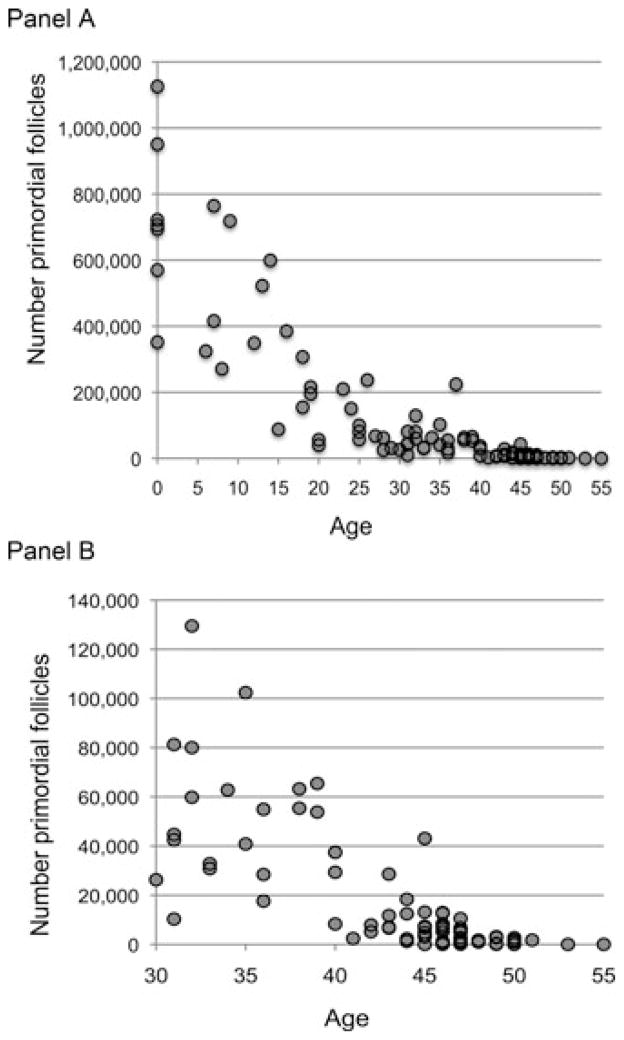
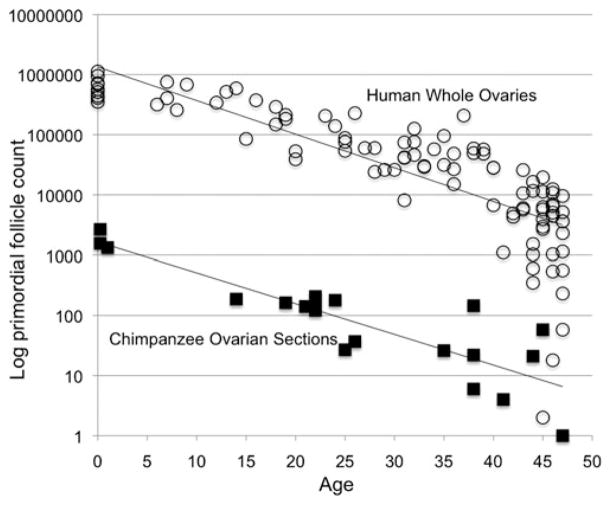
Two kinds of evidence suggest that female fertility may end at an earlier age in modern people than in ancestral populations or in our closest living relatives, chimpanzees. We investigate both to see whether fertility schedules or ovarian follicle counts falsify the alternative hypothesis that the age of terminal fertility changed little in the human lineage while greater longevity evolved due to grandmother effects. We use 19th century Utah women to represent non-contracepting humans, and compare their fertility by age with published records for wild chimpanzees. Then we revisit published counts of ovarian follicular stocks in both species. Results show wide individual variation in age at last birth and oocyte stocks in both humans and chimpanzees. This heterogeneity, combined with interspecific differences in adult mortality, has large and opposing effects on fertility schedules. Neither realized fertility nor rates of follicular atresia stand as evidence against the hypothesis that ages at last birth changed little while greater longevity evolved in our lineage.


Conflict of interest statement

Conflicts of interest

The authors declare no conflicts of interest.

Figures

Figure 1
Figure 1
Natural fertility humans and wild chimpanzees compared. The humans are 42,493 UPDB parous women born 1845–1890 who were monogamously married, neither divorced nor widowed before 50, and lived to at least that age. Chimpanzees are 165 females from four study sites compiled by Emery Thompson et al. There are 627.3 risk years in the 10–14 year chimpanzee interval, that dwindle to 7.8 in the 45–49 year interval (Ref. and supplemental data Table S2). The relative number of risk years in each 5-year interval is represented by the percentage relative to the initial adult interval (10–14) below the horizontal axis.
Figure 2
Figure 2
Chimpanzee ASFRs at three study sites. Gombe and Mahale data from Emery Thompson et al.; Tai data from Boesch and Boesch-Achermann.
Figure 3
Figure 3
Decreasing proportions of women still giving birth drive down human ASFR. Percentage of women not yet past their last delivery and percentage of maximum age-specific fertility by age for 42,493 UPDB parous women born 1845–1890 who were monogamously married, neither divorced nor widowed before 50, and lived to at least that age.
Figure 4
Figure 4
Women’s fertility rates vary with their ages at last birth. ASFR for two subsets of the 42,493 UPDB parous women born 1845–1890 who were monogamously married, neither divorced nor widowed before 50, and lived to at least that age. Fertility rates before 35 of the women whose fertility ended by 35 (n = 10,440) are compared to the rates at the same ages of the women who were fertile past 45 (n = 2659).
Figure 5
Figure 5
Age-specific fertility for women who will have future births compared to ASFR for all. ASFR for all 42,493 UPDB parous women born 1845–1890 who were monogamously married, neither divorced nor widowed before 50, and lived to at least that age (open circles), and ASFR for just the subset who will still bear offspring beyond each age (filled circles). Percentage of the 42,493 sample who will still deliver at a later age is indicated below the x-axis.
Figure 6
Figure 6
Follicle counts in humans by age. Counts are from Block,, Richardson et al., Gougeon et al. Panel A includes all cases, Panel B includes all cases for subjects over the age of 30 except one conspicuous outlier from Block’s counts evident in Panel A: 224,500 for a 37 year old.
Figure 7
Figure 7
Follicle stock depletion from birth to age 47 in humans compared to chimpanzees. The human counts are for whole ovaries from the classic sources (open circles), and the chimpanzee counts are for single ovarian sections taken at chimpanzee necropsies (closed squares), displayed here on logarithmic scale. Heights of the lines must differ because a section is only a thin slice of an ovary. The human ovaries contained about 2000 sections per ovary, (see text). Rates of follicular depletion with age are indicated by the slopes of the lines. The slope and 95% confidence interval for whole human ovaries is −0.05594 (−0.06421053, −0.04767339). For the chimpanzee sample of ovarian sections, the slope and 95% confidence interval are −0.05079 (−0.06494935, −0.03662765). These slopes are statistically indistinguishable.

Similar articles

Cited by

References

    1. Williams GC. Pleiotropy, natural selection, and the evolution of senescence. Evolution. 1957;11:398–411.
    1. Robson SL, van Schaik CP, Hawkes K. The derived features of human life history. In: Hawkes K, Paine RR, editors. The Evolution of Human Life History. School of American Research Press; Santa Fe: 2006. pp. 17–45.
    1. Oeppen J, Vaupel J. Broken limits to life expectancy? Science. 2002;296:1029–1031. - PubMed
    1. Howell N. Demography of the Dobe !Kung. Academic Press; New York: 1979.
    1. Hill K, Hurtado AM. Ache Life History: the Ecology and Demography of a Foraging People. Aldine de Gruyter; New York: 1996.

Publication types