. 2010 Oct 5;9(10):1080-9.
doi: 10.1016/j.dnarep.2010.07.009. Epub 2010 Aug 23.

The mitochondrial transcription factor A functions in mitochondrial base excision repair

Affiliations

The mitochondrial transcription factor A functions in mitochondrial base excision repair

Chandrika Canugovi et al. DNA Repair (Amst). .

Abstract

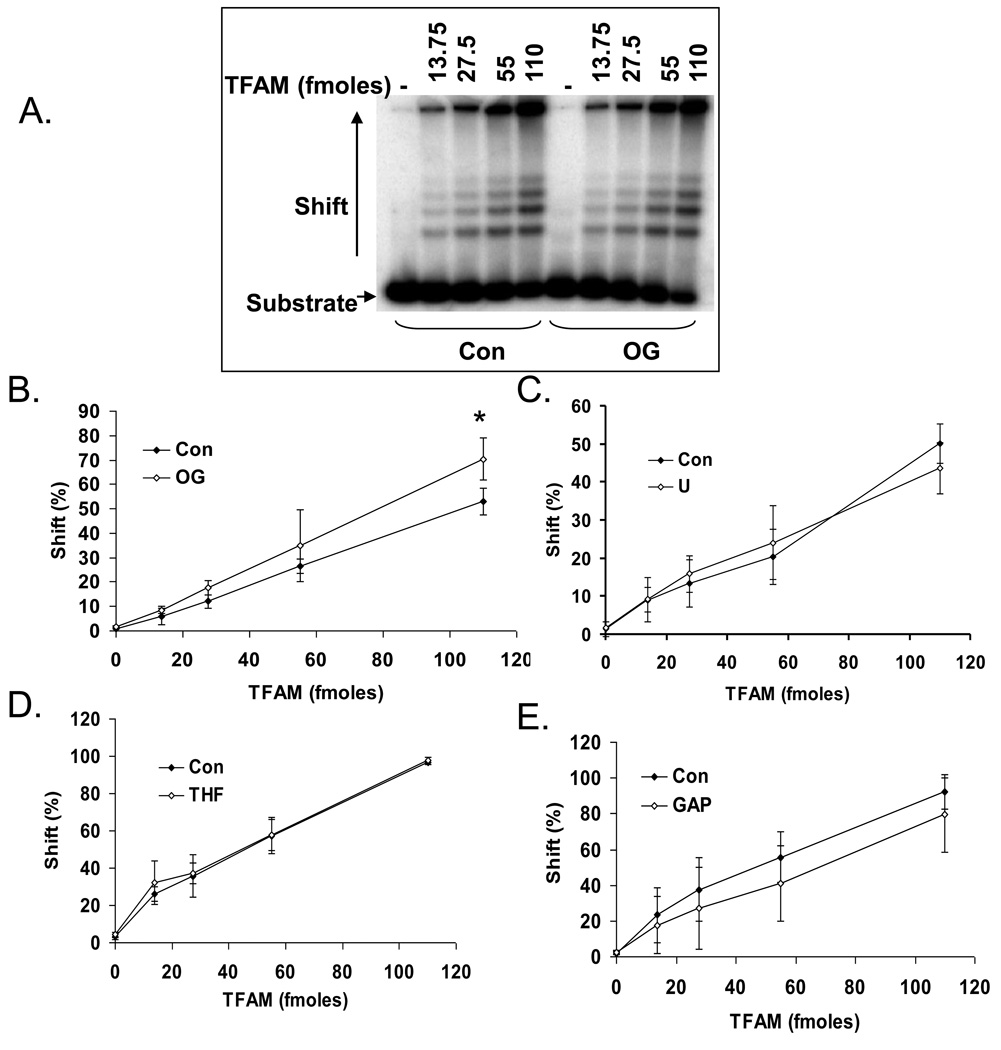
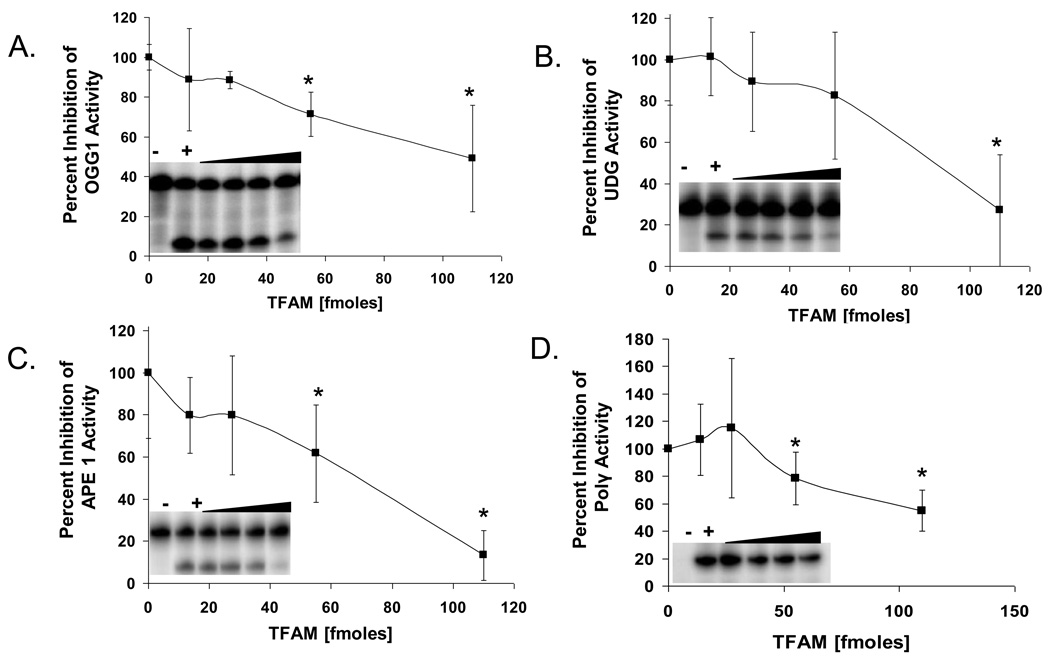
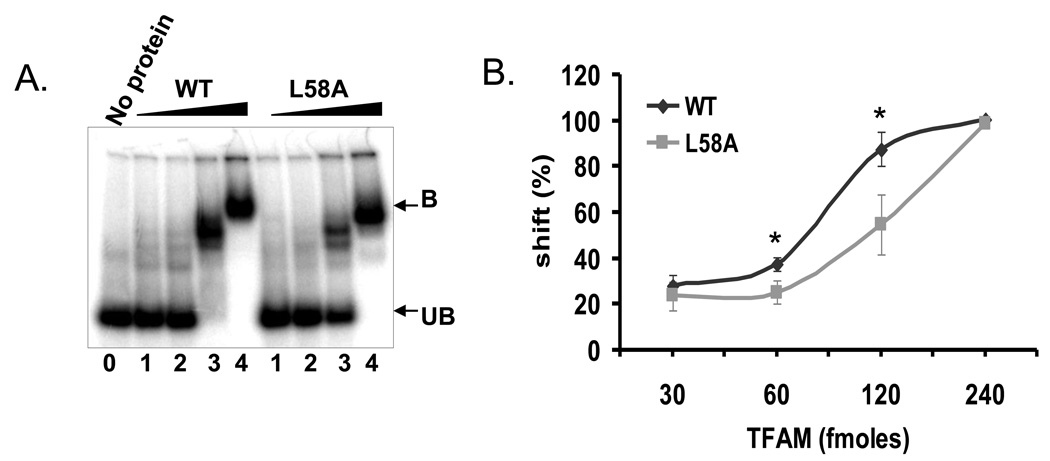
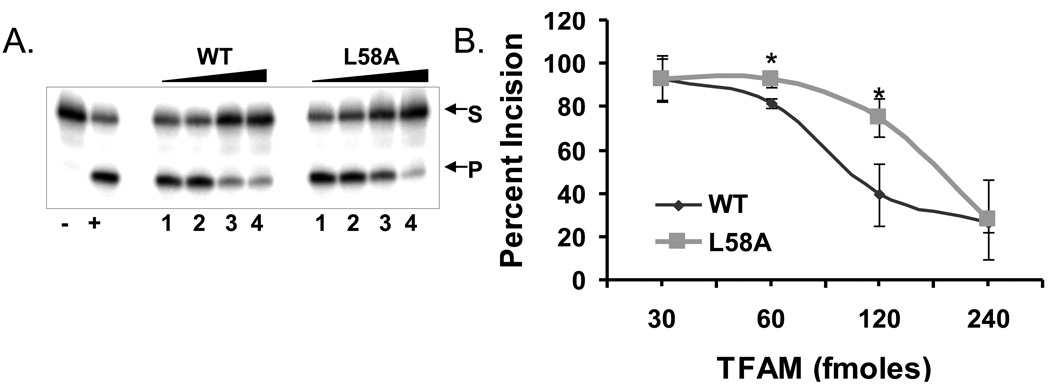
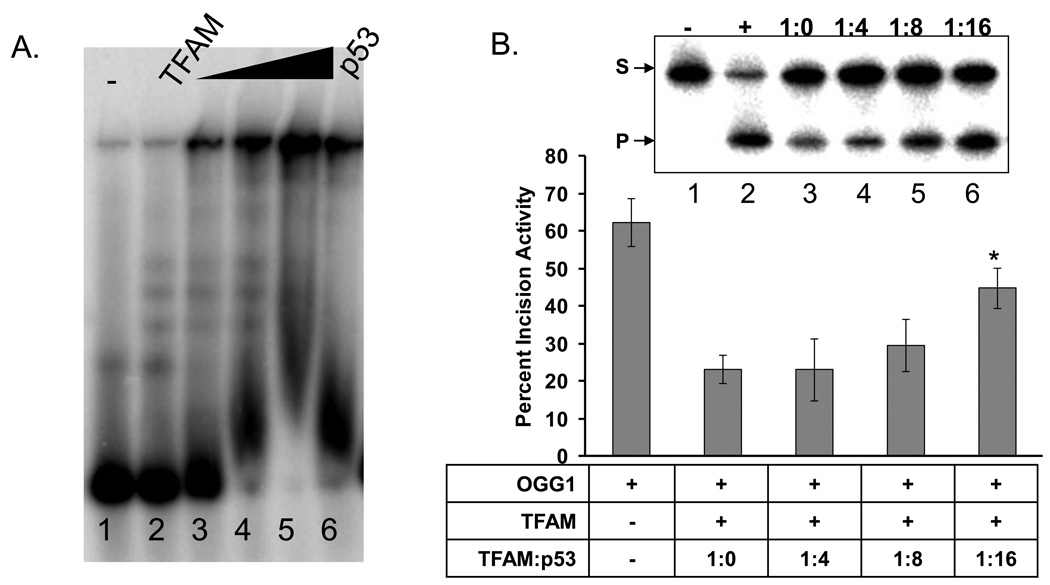
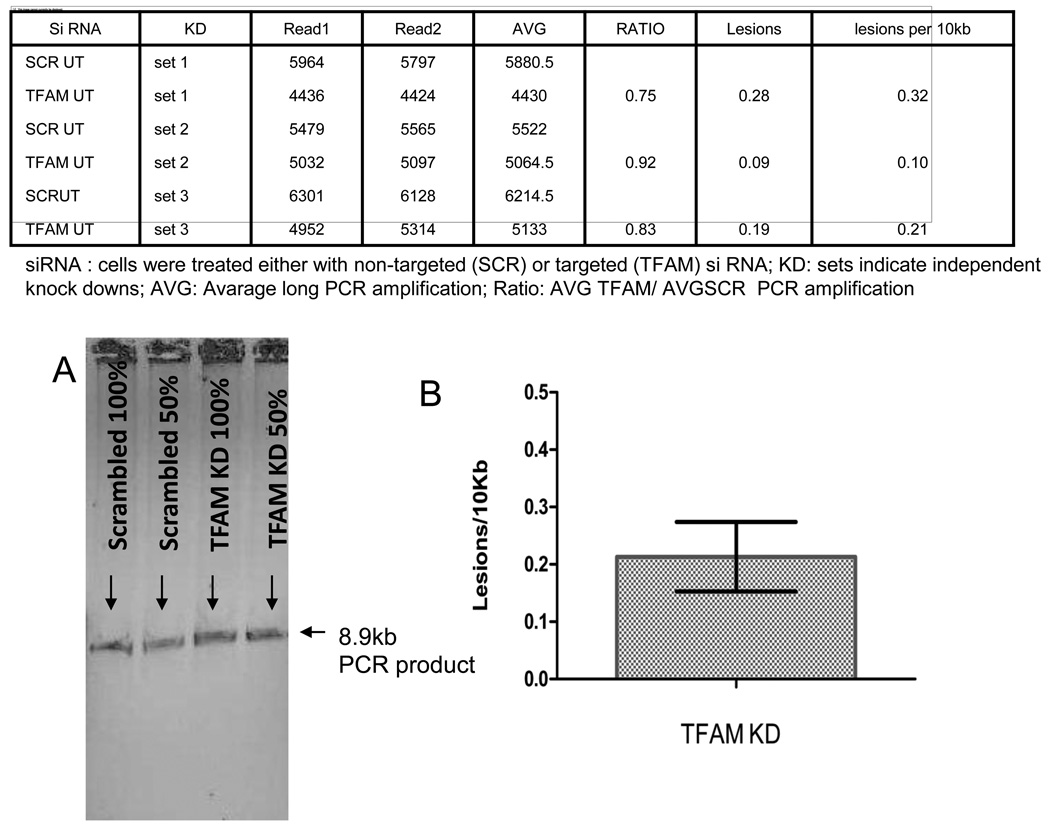
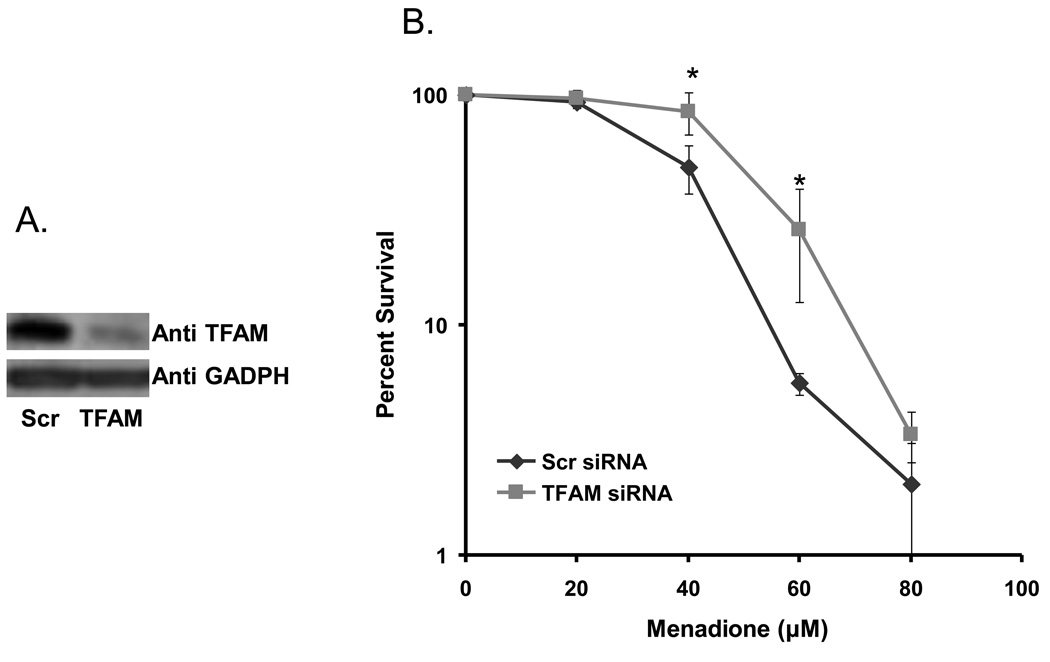
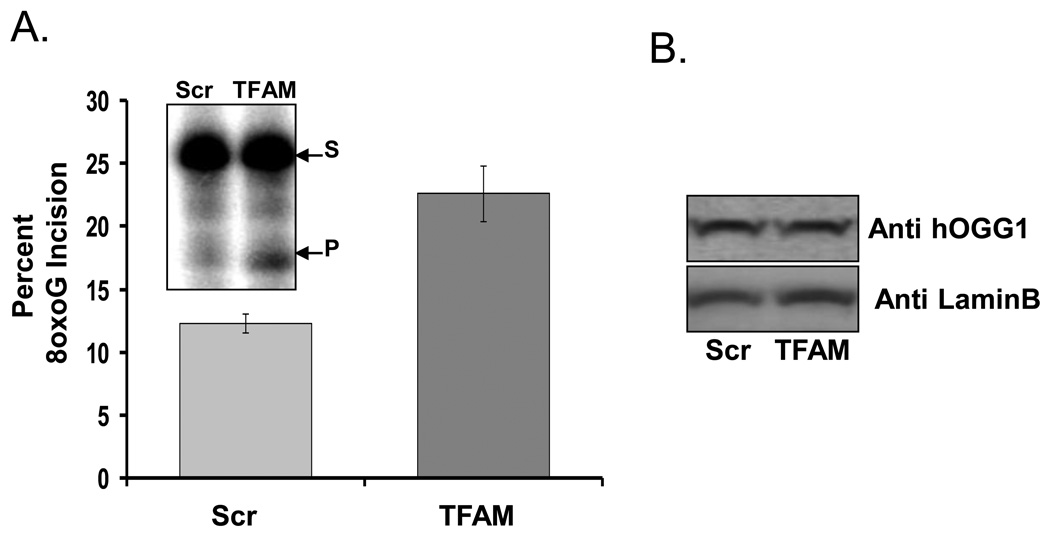
Mitochondrial transcription factor A (TFAM) is an essential component of mitochondrial nucleoids. TFAM plays an important role in mitochondrial transcription and replication. TFAM has been previously reported to inhibit nucleotide excision repair (NER) in vitro but NER has not yet been detected in mitochondria, whereas base excision repair (BER) has been comprehensively characterized in these organelles. The BER proteins are associated with the inner membrane in mitochondria and thus with the mitochondrial nucleoid, where TFAM is also situated. However, a function for TFAM in BER has not yet been investigated. This study examines the role of TFAM in BER. In vitro studies with purified recombinant TFAM indicate that it preferentially binds to DNA containing 8-oxoguanines, but not to abasic sites, uracils, or a gap in the sequence. TFAM inhibited the in vitro incision activity of 8-oxoguanine DNA glycosylase (OGG1), uracil-DNA glycosylase (UDG), apurinic endonuclease 1 (APE1), and nucleotide incorporation by DNA polymerase γ (pol γ). On the other hand, a DNA binding-defective TFAM mutant, L58A, showed less inhibition of BER in vitro. Characterization of TFAM knockdown (KD) cells revealed that these lysates had higher 8oxoG incision activity without changes in αOGG1 protein levels, TFAM KD cells had mild resistance to menadione and increased damage accumulation in the mtDNA when compared to the control cells. In addition, we found that the tumor suppressor p53, which has been shown to interact with and alter the DNA binding activity of TFAM, alleviates TFAM-induced inhibition of BER proteins. Together, the results suggest that TFAM modulates BER in mitochondria by virtue of its DNA binding activity and protein interactions.


Figures

Fig. 1
Fig. 1
Differential binding of TFAM to 8oxoG lesion. A) Electrophoretic mobility shift assay showing a typical gel used for analysis of TFAM DNA binding to a 91-mer oligonucleotide containing either an 8oxoG (OG) or normal G (Con). The numbers on top of the panel indicate the amount of TFAM used in fmoles. DNA alone without any protein is represented by the (−) symbol. TFAM binding affinity to 8oxoG (B), Uracil (C), abasic site (D) and gap (E) containing DNA relative to control (con) DNA are shown. Data represents mean ± SD of three independent experiments.
Fig. 2
Fig. 2
Effect of TFAM on BER protein activities. Graphs represent percent of control activity (in absence of TFAM) of OGG1 (A), UDG (B), APE1 (C), and pol γ (D) activities, respectively, in the presence of increasing amounts of TFAM (13.75, 27.5, 55 and 110 fmoles). Inset in each graph show a typical gel image used in the analysis of effect of TFAM on the corresponding BER protein. The lane with (−) symbol represent the negative control with no repair protein and (+) symbol in each case represents the positive control corresponding to the DNA repair enzyme alone with no TFAM. The black triangle indicates the increasing amounts of TFAM. Data are mean ± SD of three independent experiments.
Fig. 3
Fig. 3
EMSA of TFAM wild type and L58A mutant with 91-mer oligonucleotide. A) Typical EMSA gel used to quantitate the difference between binding affinity of wild type TFAM and L58A mutant. Protein bound fraction is shown by B and unbound free substrate is represented by UB. Lanes 1, 2, 3 and 4 are increasing concentrations of 30, 60, 120 and 240 fmoles of TFAM wild type (WT) and mutant (L58A). Lane 0 represents substrate alone without any protein. B) Data represents the percent mobility shift of protein bound DNA fraction with respect to the concentration of the protein used. Data are mean ± SD of three experiments. The * symbol indicates the p-value for the corresponding concentration of protein used (p-values 0.022 and 0.019, respectively at 30 and 60 fmoles).
Fig. 4
Fig. 4
In vitro incision assay with TFAM wild type and L58A mutant. A) A typical gel used for determining the OGG1 activity in the presence of TFAM wild type (WT) or mutant (L58A) is shown. Lanes 1, 2, 3 and 4 are increasing concentrations of 30, 60, 120 and 240 fmoles of TFAM wild type (WT) and mutant (L58A). Lane (−) represents substrate alone without any protein and (+) represents positive control for the OGG1 protein alone with no TFAM. S and P represent substrate and product bands respectively. B) Graph represents OGG1 activity in the presence of increasing amounts of TFAM wild type (WT) and mutant (L58A). Data are mean ± SD of three independent experiments. The * symbol indicates the p-value for the corresponding concentration of protein used (p-values 0.008 and 0.02, respectively at 30 and 60 fmoles).
Fig. 5
Fig. 5
p53 alters TFAM DNA binding and reverses OGG1 inhibition by TFAM. A. A typical gel showing the effect of increasing concentrations of p53 (lanes 3–5 are 50, 100 and 200 ngs of p53, respectively) on TFAM DNA binding by EMSA. The ramp represents the increasing concentrations of p53. B. Upper panel shows a representative gel used to quantitate the OGG1 activity, in the presence of TFAM alone (1:0) and increasing amounts of p53 with respect to TFAM in the molar ratios of 1:4, 1:8 and 1:16. Graph represents the OGG1 activity in the presence of the two variables TFAM and p53. Data are mean ± SD of three independent experiments. The * symbol indicates the p-value of 0.0045 for 1:16 TFAM to p53 used.
Fig 6
Fig 6
Effect of TFAM knockdown on damage accumulation in the mitochondrial DNA. Table shows long (8.9kb) PCR amplification from mtDNA obtained from three biological replicates of TFAM knockdown in HELA cells. Ratio of average PCR amplifications (AVG) from Scr (scrambled) to TFAM KD was calculated. This was converted into lesions per 10kb by Poisson’s distribution. Panel A shows the relative amplification of an 8.5-Kb mtDNA fragment from DNA purified from control (Scr) and knockdown (TFAM) cells. Panel B shows the relative amplification of the 8.5 kb PCR product amplified without any contamination.
Fig. 7
Fig. 7
Cell survival assay. A) Western blot of TFAM and GADPH (loading control) protein levels in TFAM control (Scr) and knockdown (TFAM) cellular lysates corresponding to the survival assay on day (three days after transfection). B) Graph represents relative cell survival for scrambled and TFAM knockdown siRNA treated cells after treatment with increasing concentrations of menadione. Data are mean ± SD of three experiments. The * symbol indicates p values of 0.0023 and 0.0076, respectively for 40 and 60 µM menadione treatments.
Fig. 8
Fig. 8
Effect of TFAM knockdown on overall 8oxoG incision activity A) Data are percent 8oxoG incision activity observed in control (Scr) and TFAM knockdown (TFAM) Hela cell lysates. Inset is a representative gel for the incision assay where s=substrate band and p=product band. Results are means ± SD of three experiments. B) Western blot analysis of OGG1 protein levels in either the control (Scr) or knockdown (TFAM) cellular lysates used in panel ‘A’ is shown.

References

    1. Kregel KC, Zhang HJ. An integrated view of oxidative stress in aging: basic mechanisms, functional effects, and pathological considerations. Am. J. Physiol Regul. Integr. Comp Physiol. 2007;292:R18–R36. - PubMed
    1. de Souza-Pinto NC, Harris CC, Bohr VA. p53 functions in the incorporation step in DNA base excision repair in mouse liver mitochondria 19. Oncogene. 2004;23:6559–6568. - PubMed
    1. Iborra FJ, Kimura H, Cook PR. The functional organization of mitochondrial genomes in human cells. BMC. Biol. 2004;2:9. - PMC - PubMed
    1. Kaufman BA, Durisic N, Mativetsky JM, Costantino S, Hancock MA, Grutter P, Shoubridge EA. The mitochondrial transcription factor TFAM coordinates the assembly of multiple DNA molecules into nucleoid-like structures 2. Mol. Biol. Cell. 2007;18:3225–3236. - PMC - PubMed
    1. Parisi MA, Clayton DA. Similarity of human mitochondrial transcription factor 1 to high mobility group proteins. Science. 1991;252:965–969. - PubMed

Publication types

MeSH terms