. 2010 Nov 5;285(45):34999-5010.
doi: 10.1074/jbc.M110.164418. Epub 2010 Aug 25.

In vitro and in vivo analysis of the binding of the C terminus of the HDL receptor scavenger receptor class B, type I (SR-BI), to the PDZ1 domain of its adaptor protein PDZK1

Affiliations

In vitro and in vivo analysis of the binding of the C terminus of the HDL receptor scavenger receptor class B, type I (SR-BI), to the PDZ1 domain of its adaptor protein PDZK1

Olivier Kocher et al. J Biol Chem. .

Abstract

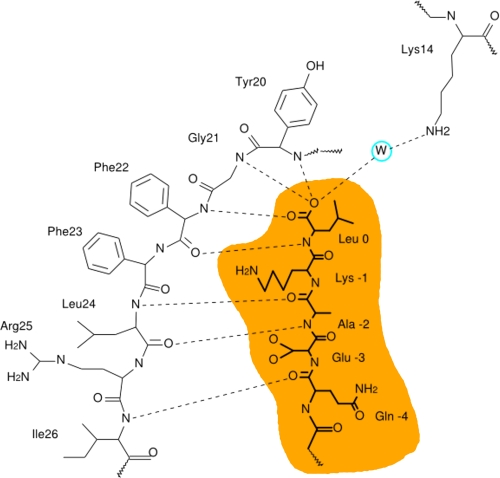
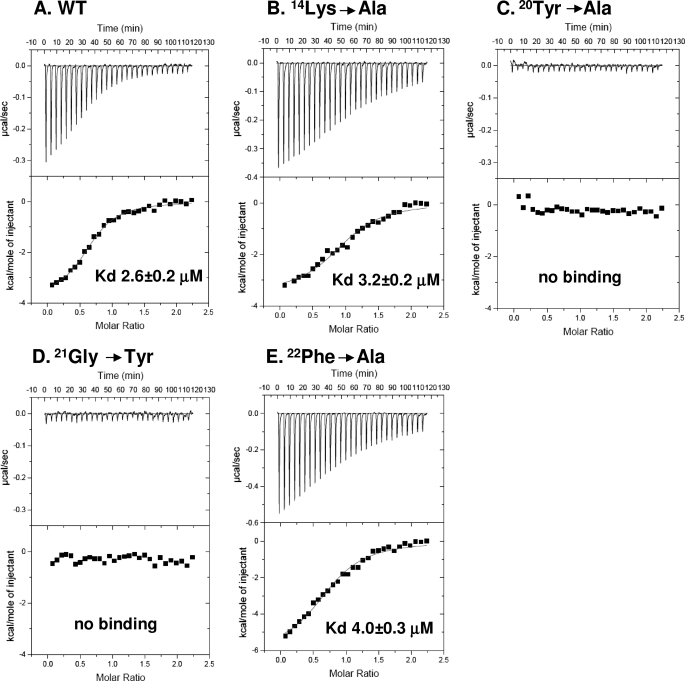
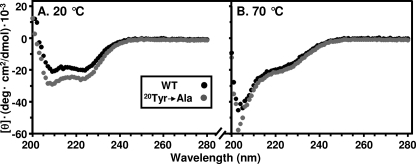
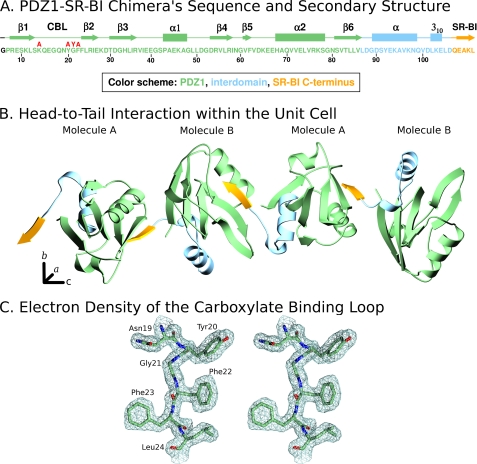
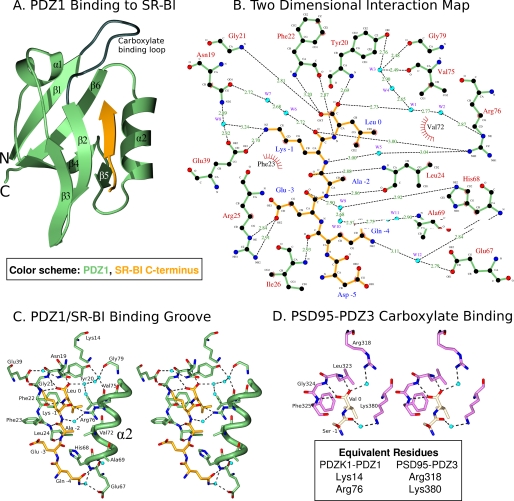
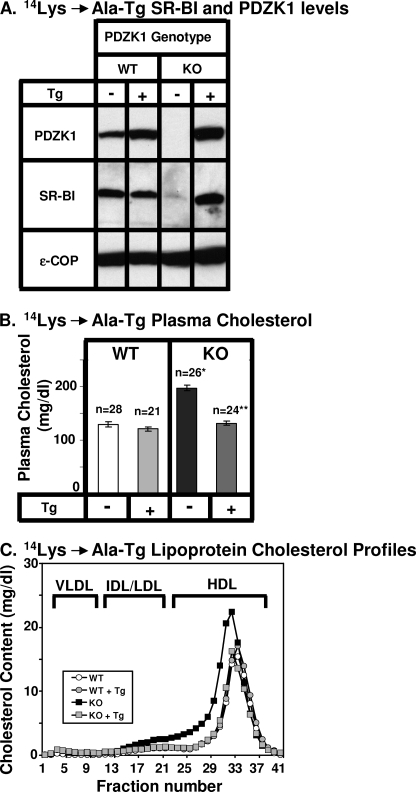
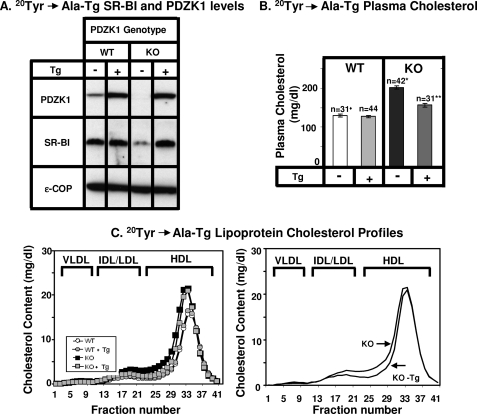
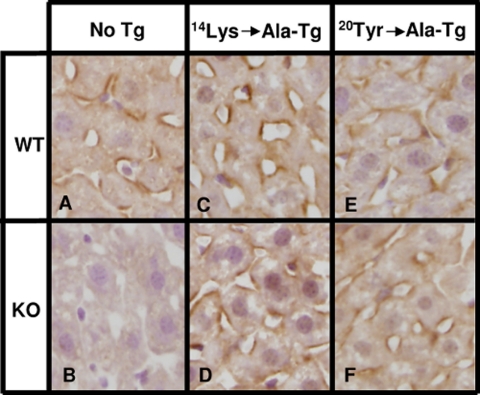
The PDZ1 domain of the four PDZ domain-containing protein PDZK1 has been reported to bind the C terminus of the HDL receptor scavenger receptor class B, type I (SR-BI), and to control hepatic SR-BI expression and function. We generated wild-type (WT) and mutant murine PDZ1 domains, the mutants bearing single amino acid substitutions in their carboxylate binding loop (Lys(14)-Xaa(4)-Asn(19)-Tyr-Gly-Phe-Phe-Leu(24)), and measured their binding affinity for a 7-residue peptide corresponding to the C terminus of SR-BI ((503)VLQEAKL(509)). The Y20A and G21Y substitutions abrogated all binding activity. Surprisingly, binding affinities (K(d)) of the K14A and F22A mutants were 3.2 and 4.0 μM, respectively, similar to 2.6 μM measured for the WT PDZ1. To understand these findings, we determined the high resolution structure of WT PDZ1 bound to a 5-residue sequence from the C-terminal SR-BI ((505)QEAKL(509)) using x-ray crystallography. In addition, we incorporated the K14A and Y20A substitutions into full-length PDZK1 liver-specific transgenes and expressed them in WT and PDZK1 knock-out mice. In WT mice, the transgenes did not alter endogenous hepatic SR-BI protein expression (intracellular distribution or amount) or lipoprotein metabolism (total plasma cholesterol, lipoprotein size distribution). In PDZK1 knock-out mice, as expected, the K14A mutant behaved like wild-type PDZK1 and completely corrected their hepatic SR-BI and plasma lipoprotein abnormalities. Unexpectedly, the 10-20-fold overexpressed Y20A mutant also substantially, but not completely, corrected these abnormalities. The results suggest that there may be an additional site(s) within PDZK1 that bind(s) SR-BI and mediate(s) productive SR-BI-PDZK1 interaction previously attributed exclusively to the canonical binding of the C-terminal SR-BI to PDZ1.


Figures

FIGURE 1.
FIGURE 1.
Schematic representation of the predicted interactions between the C terminus of SR-BI and the CBL of the first PDZ domain (PDZ1) of PDZK1. The predicted hydrogen bonding interactions (dashed lines) between the CBL of PDZ1 and the C-terminal pentapeptide from SR-BI (−4QEAKL0, shaded orange) are based on the structure of the third PDZ domain of PSD-95 and its bound target peptide (2). A water (W) is expected to mediate at least partial neutralization of the negative charge of the carboxylate of Leu0 of the target peptide by the positive side chain of Lys14 in the CBL.
FIGURE 2.
FIGURE 2.
ITC analysis of the binding of a C-terminal peptide from SR-BI to recombinant WT and mutant PDZ1 domains. The indicated WT (A) or mutant (B–E) PDZ1 domains (0.01–0.03 mm in 1.8 ml of 150 mm NaCl, 0.5 mm tris(2-carboxyethyl)phosphine, 25 mm Tris, pH 8.0) were placed in a titration cell and equilibrated at 20 °C. A solution containing a seven-residue peptide from the C terminus of SR-BI-503VLQEAKL509 (0.18 to 0.6 mm) was added in 10-μl injections with an interval of 4 min between each injection to permit re-equilibration. Titration curves were analyzed and Kd values determined using ORIGIN 5.0 software.
FIGURE 3.
FIGURE 3.
CD spectra of WT PDZ1 and Y20A PDZ1 mutant. Purified recombinant WT PDZ1 (black) and the Y20A PDZ1 mutant (gray) proteins (40 μm in PBS containing 1 mm DTT, pH 7.4) were subjected to CD spectroscopy at 20 °C (A) and subsequently heated to 70 °C and re-analyzed (B) as described under “Experimental Procedures.”
FIGURE 4.
FIGURE 4.
X-ray crystal structure of a PDZ1-SR-BI chimera. A, amino acid sequence of the recombinant chimeric protein used for crystallization as follows: N-terminal glycine (black), PDZ1 (residues 7–86 (PDZK1 numbering), green), partial interdomain segment (87–106, lies between the PDZ1 and PDZ2 domains, blue), and five C-terminal residues of SR-BI (505QEAKL509, SR-BI numbering, yellow), The positions of the regions of secondary structure (β strands, α-, and 310-helices) and the CBL are indicated above the sequence, as are the single amino acid substitutions examined in this study (red). B, unit cell representation showing the head-to-tail arrangement of PDZ1-SR-BI chimeric molecules. This figure was generated using MOLSCRIPT (47) using the color scheme in A. C, stereo view of the electron density map (contoured at 2.5σ) and associated molecular model of a portion of the CBL (residues 19–24) at 1.80 Å resolution.
FIGURE 5.
FIGURE 5.
Structure of the C terminus of SR-BI binding to the PDZ1 domain of PDZK1. A, ribbon diagram showing the three-dimensional structure of PDZ1 (residues 7–86, green with gray carboxylate binding loop) and the bound C terminus of SR-BI (−4QEAKL0) from an adjacent molecule. The six β-strands (β1–β6), two α-helices (α1–α2), and carboxylate binding loop (dark gray) are indicated. SR-BI C terminus (yellow) is bound in a groove between the β2-strand and α2-helix. The N-terminal glycine and interdomain residues (see Fig. 4) are not shown. B, two-dimensional representation of interactions between PDZ1 (green) and C terminus of SR-BI (yellow). Water molecules (W1, W2, etc.) are shown as cyan spheres. Hydrogen bonds are shown as dashed lines and hydrophobic interactions as arcs with radial spokes. This figure was generated using LIGPLOT (48). C, stereo representation of the ligand-binding groove of PDZ1 (green) and the bound C terminus of SR-BI (yellow). Oxygen atoms, nitrogen atoms, and waters are shown in red, dark blue, and cyan, respectively. Hydrogen bonds are shown as dashed lines. The orientation is similar to that in A. D, stereo representation of a portion of the ligand-binding groove of the third PDZ domain of PSD95 (PSD95-PDZ3, violet) and the two C-terminal residues of its bound ligand (Ser−1-Val0, beige) (2). Oxygen atoms, nitrogen atoms, and waters are shown in red, blue, and cyan, respectively. Hydrogen bonds are shown as dashed lines. The orientation is similar to that in C, and the residues in equivalent positions to Lys14 and Arg76 in PDZK1 are indicated.
FIGURE 6.
FIGURE 6.
Effects of expression of the PDZK1(K14A) transgene on hepatic SR-BI protein levels (A) and plasma lipoprotein cholesterol (B and C) in WT and PDZK1 KO mice. A, liver lysates (∼30 μg of protein) from mice with the indicated genotypes, with (+) or without (−) the PDZK1(K14A) Tg, were analyzed by immunoblotting, and bands representing PDZK1 (∼70 kDa) and SR-BI (∼82 kDa) were visualized by chemiluminescence. ϵ-COP (∼34 kDa) was used as a loading control. Note the faint SR-BI band in the nontransgenic PDZK1 KO lane. Replicate experiments with multiple exposures and sample loadings were used to determine the relative levels of expression of SR-BI. All bands in adjacent panels were from a single gel. WT and WT (K14A-Tg) data were all from a single gel but reordered for clarity of presentation. B, plasma samples were harvested from mice with the indicated genotypes and PDZK1(K14A) transgene. Total plasma cholesterol levels were determined in individual samples by enzymatic assay, and mean values from the indicated numbers of animals (n) are shown for each genotype. Independent WT and KO control animals for each founder line were generated to ensure that the mixed genetic backgrounds for experimental and control mice were matched. * indicates the nontransgenic KO plasma cholesterol levels were statistically significantly different from those plasma cholesterol levels of WT (p < 0.0001). ** indicates PDZK1 KO (K14A-Tg) plasma cholesterol levels were statistically significantly different from those plasma cholesterol levels of nontransgenic PDZK1 KO mice (p < 0.0001). WT, WT (K14A-Tg), and KO (K14A-Tg) plasma cholesterol levels were not statistically significantly different. C, plasma samples (described in B) from individual animals were size-fractionated by FPLC, and the total cholesterol content of each fraction was determined by an enzymatic assay. The chromatograms are representative of multiple individually determined profiles. Approximate elution positions of native VLDL, IDL/LDL, and HDL particles are indicated by brackets and were determined as described previously (15).
FIGURE 7.
FIGURE 7.
Effects of expression of the PDZK1(Y20A) transgene on hepatic SR-BI protein levels (A) and plasma lipoprotein cholesterol (B and C) in WT and PDZK1 KO mice. A, liver lysates (∼30 μg of protein) from mice with the indicated genotypes, with (+) or without (−) the PDZK1(Y20A) Tg, were analyzed by immunoblotting, and bands representing PDZK1 (∼70 kDa) and SR-BI (∼82 kDa) were visualized by chemiluminescence. ϵ-COP (∼34 kDa) was used as a loading control. Note the faint SR-BI band in the nontransgenic PDZK1 KO lane. Replicate experiments with multiple exposures and sample loadings were used to determine the relative levels of expression of SR-BI. All bands in adjacent panels were from a single gel. WT and WT (Y20A-Tg) data were all from a single gel but reordered for clarity of presentation. B, plasma samples were harvested from mice with the indicated genotypes and PDZK1(Y20A) transgene. Total plasma cholesterol levels were determined in individual samples by enzymatic assay, and mean values from the indicated numbers of animals (n) are shown for each genotype. Independent WT and KO control animals for each founder line were generated to ensure that the mixed genetic backgrounds for experimental and control mice were matched. * indicates the nontransgenic PDZK1 KO plasma cholesterol levels were statistically significantly different from those plasma cholesterol levels of WT (p < 0.0001). ** indicates PDZK1 KO (Y20A-Tg) plasma cholesterol levels were statistically significantly different from those plasma cholesterol levels of nontransgenic PDZK1 WT and KO mice (p < 0.0001). WT and WT(Y20A-Tg) plasma cholesterol levels were not statistically significantly different. C, plasma samples (described in B) from individual animals were size-fractionated by FPLC, and the total cholesterol content of each fraction was determined by an enzymatic assay. The chromatograms are representative of multiple individually determined profiles. Approximate elution positions of native VLDL, IDL/LDL, and HDL particles are indicated by brackets and were determined as described previously (15).
FIGURE 8.
FIGURE 8.
Immunohistochemical analysis of hepatic SR-BI in WT and PDZK1 KO nontransgenic (A and B), PDZK1(K14A) transgenic (C and D), and PDZK1(Y20A) transgenic (E and F) mice. Livers from mice of the indicated genotypes and Tg were fixed, frozen, and sectioned. The sections were then stained with a polyclonal anti-SR-BI antibody and a biotinylated anti-rabbit IgG secondary antibody and visualized by immunoperoxidase staining. Magnification, ×600.

Similar articles

Cited by

References

    1. van Ham M., Hendriks W. (2003) Mol. Biol. Rep. 30, 69–82 - PubMed
    1. Doyle D. A., Lee A., Lewis J., Kim E., Sheng M., MacKinnon R. (1996) Cell 85, 1067–1076 - PubMed
    1. Tonikian R., Zhang Y., Sazinsky S. L., Currell B., Yeh J. H., Reva B., Held H. A., Appleton B. A., Evangelista M., Wu Y., Xin X., Chan A. C., Seshagiri S., Lasky L. A., Sander C., Boone C., Bader G. D., Sidhu S. S. (2008) PLoS Biol. 6, e239. - PMC - PubMed
    1. Pawson T., Scott J. D. (1997) Science 278, 2075–2080 - PubMed
    1. Kocher O., Comella N., Tognazzi K., Brown L. F. (1998) Lab. Invest. 78, 117–125 - PubMed

Publication types

MeSH terms

Associated data