Nutritional state and collective motion: from individuals to mass migration
- PMID: 20739320
- PMCID: PMC3013415
- DOI: 10.1098/rspb.2010.1447
Nutritional state and collective motion: from individuals to mass migration
Erratum in
- Proc Biol Sci. 2012 Aug 22;279(1741):3376
Abstract
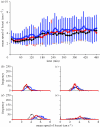
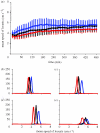
In order to move effectively in unpredictable or heterogeneous environments animals must make appropriate decisions in response to internal and external cues. Identifying the link between these components remains a challenge for movement ecology and is important in understanding the mechanisms driving both individual and collective motion. One accessible way of examining how internal state influences an individual's motion is to consider the nutritional state of an animal. Our experimental results reveal that nutritional state exerts a relatively minor influence on the motion of isolated individuals, but large group-level differences emerge from diet affecting inter-individual interactions. This supports the idea that mass movement in locusts may be driven by cannibalism. To estimate how these findings are likely to impact collective migration of locust hopper bands, we create an experimentally parametrized model of locust interactions and motion. Our model supports our hypothesis that nutrient-dependent social interactions can lead to the collective motion seen in our experiments and predicts a transition in the mean speed and the degree of coordination of bands with increasing insect density. Furthermore, increasing the interaction strength (representing greater protein deprivation) dramatically reduces the critical density at which this transition occurs, demonstrating that individuals' nutritional state could have a major impact on large-scale migration.
Figures


References
-
- Couzin I. D. 2007. Collective minds. Nature 445, 715. 10.1038/445715a (doi:10.1038/445715a) - DOI - PubMed
-
- Czirok A., Stanley H. E., Vicsek T. 1997. Spontaneously ordered motion of self-propelled particles. J. Phys. A Math. Theor. 30, 1375–1385
-
- Parrish J. K., Edelstein-Keshet L. 1999. Complexity, pattern, and evolutionary trade-offs in animal aggregations. Science 284, 99–101 10.1126/science.284.5411.99 (doi:10.1126/science.284.5411.99) - DOI - PubMed
-
- Vicsek T., Czirók A., Ben-Jacob E., Cohen I., Shochet O. 1995. Novel type of phase transition in a system of self driven particles. Phys. Rev. Lett. 75, 1226–1229 10.1103/PhysRevLett.75.1226 (doi:10.1103/PhysRevLett.75.1226) - DOI - PubMed
-
- Deisboeck T. S., Couzin I. D. 2009. Collective behaviour in cancer cell populations. BioEssays 31, 190–197 10.1002/bies.200800084 (doi:10.1002/bies.200800084) - DOI - PubMed
Publication types
MeSH terms
Substances
LinkOut - more resources
Full Text Sources
