. 2011 Jan 21;52(1):485-93.
doi: 10.1167/iovs.10-5801. Print 2011 Jan.

TRPV1 activation is required for hypertonicity-stimulated inflammatory cytokine release in human corneal epithelial cells

Affiliations

TRPV1 activation is required for hypertonicity-stimulated inflammatory cytokine release in human corneal epithelial cells

Zan Pan et al. Invest Ophthalmol Vis Sci. .

Abstract

Purpose: To determine whether hypertonic stress promotes increases in inflammatory cytokine release through transient receptor potential vanilloid channel type 1 (TRPV1) signaling pathway activation in human corneal epithelial cells (HCECs).

Methods: Hyperosmotic medium was prepared by supplementing isotonic Ringers solution with sucrose. Ca2+ signaling was measured in fura2-AM-loaded HCECs using a single-cell fluorescence imaging system. Western blot analysis evaluated the phosphorylation status of EGFR, ERK, p38 MAPK, and nuclear factor (NF)-κB. ELISA assessed the effect of TRPV1 activation on the release of IL-6 and IL-8.

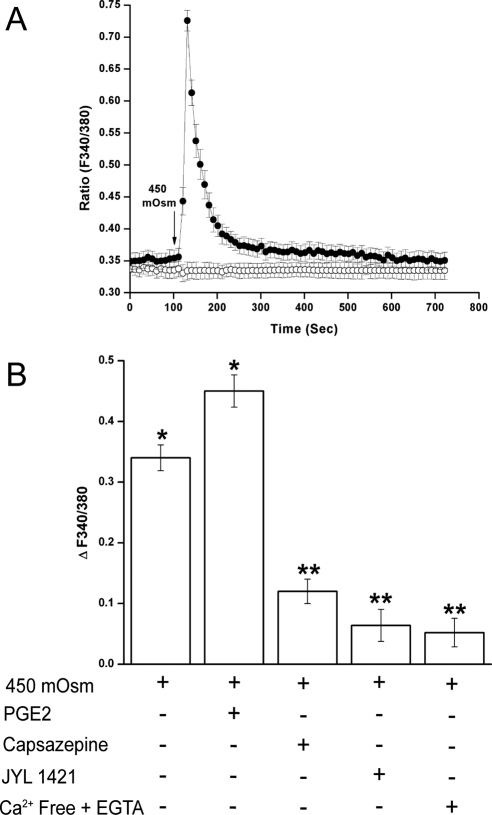
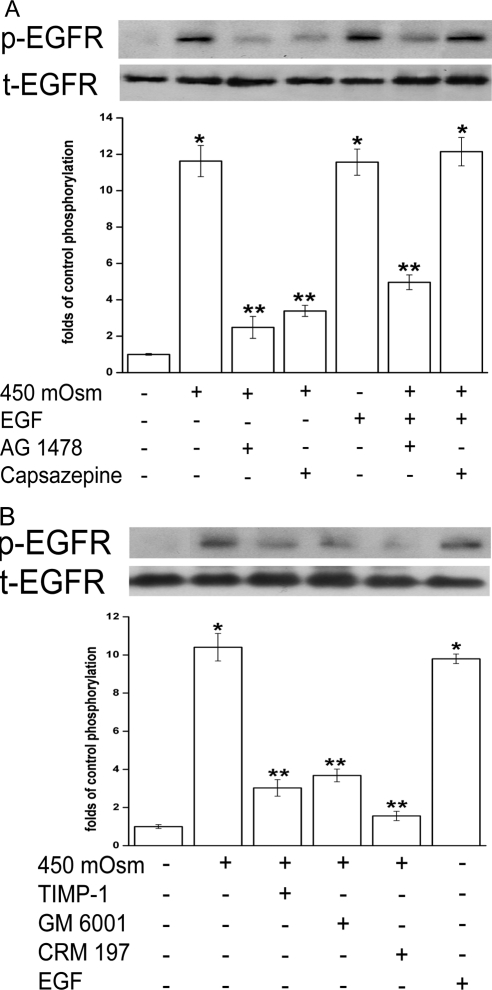
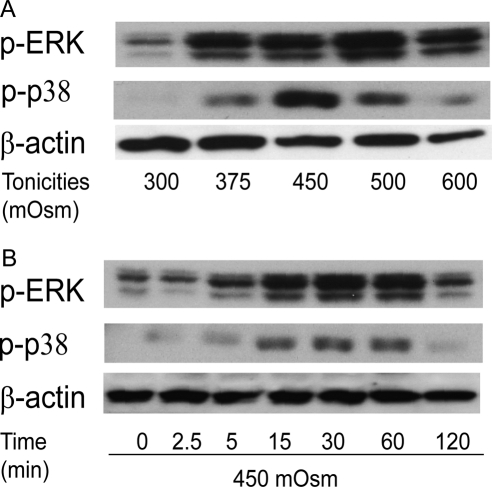
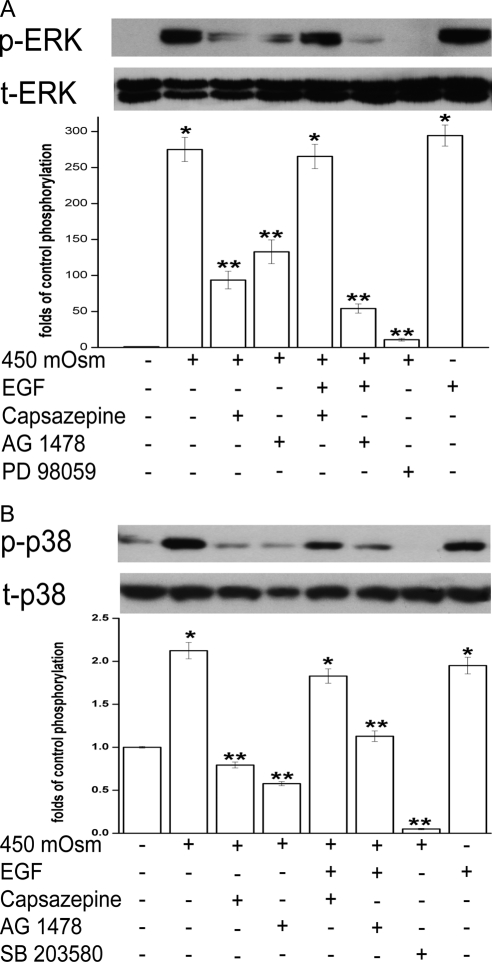
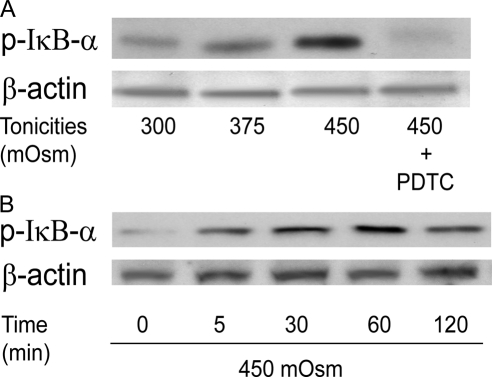
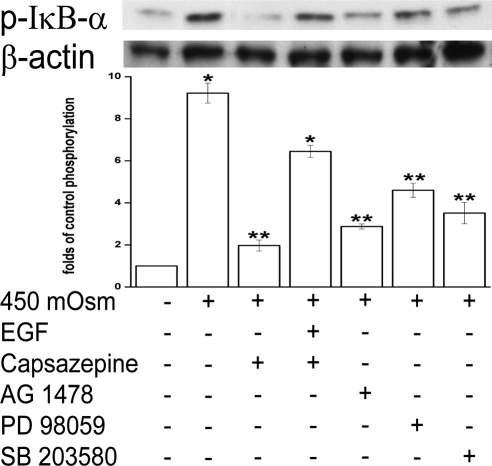
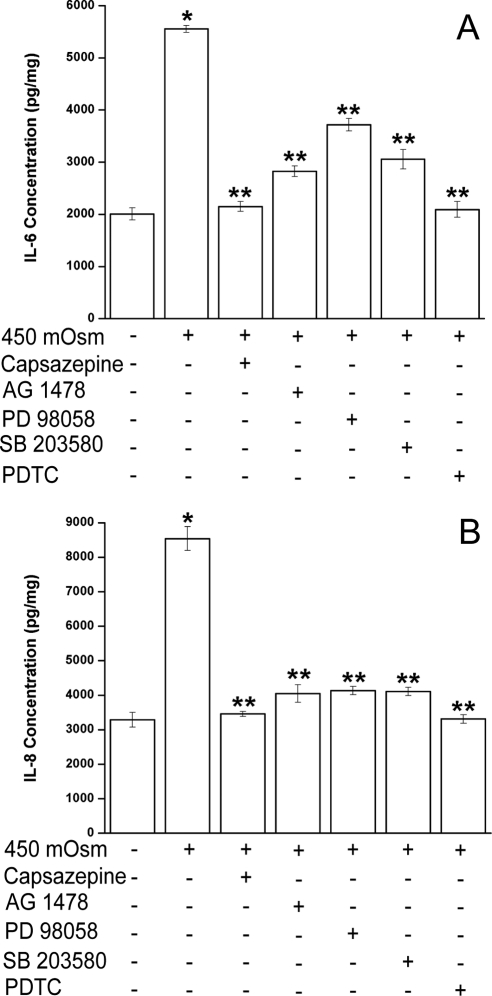
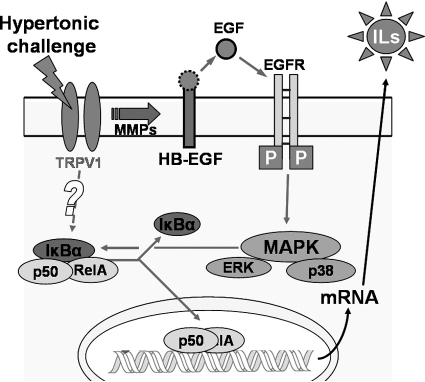
Results: A 450 mOsm hypertonic stress elicited 2-fold Ca2+ transients that were suppressed by the TRPV1-selective antagonists capsazepine and JYL 1421. Such transients were enhanced by PGE2. Hypertonicity-induced EGF receptor (EGFR) transactivation was suppressed by preincubating HCECs with capsazepine, matrix metalloproteinase 1 (MMP1) inhibitor TIMP-1, broad-spectrum MMP inhibitor GM 6001, heparin-bound (HB)-EGF inhibitor CRM 197, or EGFR inhibitor AG 1478. ERK and p38 MAPK and NF-κB activation after EGFR transactivation occurred in tonicity and in a time-dependent manner. Hypertonicity-induced increases in IL-6 and IL-8 releases were suppressed by exposure to capsazepine, AG 1478, ERK inhibitor PD 98059, p38 inhibitor SB 203580, or NF-κB inhibitor PDTC.

Conclusions: Hypertonic stress-elicited TRPV1 channel stimulation mediates increases in a proinflammatory cytokine IL-6 and a chemoattractant IL-8 by eliciting EGFR transactivation, MAPK, and NF-κB activation. Selective drug modulation of either TRPV1 activity or its signaling mediators may yield a novel approach to suppressing inflammatory responses occurring in dry eye syndrome.


Figures

Figure 1.
Figure 1.
Hypertonicity-induced TRPV1 activation in HCECs. (A) Fluorescence intensity output at 510 nm was monitored, resulting from alternate excitation of wavelengths 340 and 380 nm. Their ratios were indicative of relative changes in intracellular Ca2+ concentration. The basal fluorescence level was measured for 2 minutes, followed by a 10-minute recording in 450 mOsm sucrose-enhanced medium (filled circle). Control fluorescence trace (open circle) was obtained in the 300 mOsm iso-osmotic medium. A sham substitution was performed after 2 minutes that did not change the fluorescence ratio. The arrow under fluorescence traces indicate the presence of 450 mOsm or sham (300 mOsm) medium. (B) Cells were pretreated with PGE2 (1 μM), TRPV1 inhibitor capsazepine (10 μM) or JYL 1421 (1 μM), or exposure to Ca2+-free medium added with 2 mM EGTA for 30 minutes before 450 mOsm medium was introduced. Changes in fluorescence intensity are summarized and expressed as mean ± SEM (n = 3). Each of the indicated conditions was performed in triplicate, and 5 to 10 cells per condition were monitored. *P < 0.01 vs. untreated control. **P < 0.01 vs. treated with 450 mOsm medium alone.
Figure 2.
Figure 2.
Dependence of hypertonicity-induced EGFR transactivation on TRPV1 stimulation. (A) Cells were pretreated for 30 minutes with a TRPV1 antagonist capsazepine (10 μM) or an EGFR inhibitor AG 1478 (10 μM) before 450 mOsm medium or EGF (5 ng/mL) was introduced. (B) Cells were pretreated for 30 minutes with an MMP-1 inhibitor TIMP-1 (100 ng/mL), a broad-spectrum MMP inhibitor GM 6001 (50 μM), or an HB-EGF inhibitor CRM 197 (10 μg/mL), followed by exposure to 450 mOsm medium for 5 minutes. Exposure to EGF alone served as a positive control. Cell extracts were probed for phosphorylated EGFR (p-EGFR) using anti–p-EGFR antibody by Western blot analysis. Membranes were then stripped and reprobed for total EGFR (t-EGFR) using anti–t-EGFR antibody. Amounts of t-EGFR served as loading controls. Results of a representative experiment are given. Results are summarized in a bar graph below and expressed as mean ± SEM (n = 3). *P < 0.01 vs. untreated control. ** P < 0.01 vs. treated with 450 mOsm medium alone.
Figure 3.
Figure 3.
Hypertonicity activation of ERK and p38 MAPK in a tonicity- and a time-dependent manner. (A) Cells were exposed to 300, 375, 450, 500, and 600 mOsm media for 15 minutes. (B) Cells were exposed to 450 mOsm medium for 0, 2.5, 5, 15, 30, 60, and 120 minutes. Western blot analysis was used to detect phosphorylated ERK (p-ERK) and phosphorylated p38 (p-p38). Membranes were then stripped and reprobed for β-actin to validate the loading equivalence.
Figure 4.
Figure 4.
Effects of TRPV1 and EGFR modulation on hypertonicity-induced ERK and p38 MAPK activation. (A) Cells were pretreated for 30 minutes with capsazepine (10 μM), AG 1478 (10 μM), or an ERK inhibitor PD 98059 (10 μM) before exposure to 450 mOsm medium or EGF (5 ng/mL). Cell extracts were subjected to Western blot analysis with anti–p-ERK. Membranes were then stripped and reprobed for total ERK (t-ERK) using anti–t-ERK antibody. (B) Cells were pretreated for 30 minutes with either capsazepine (10 μM), AG 1478 (10 μM), or p38 inhibitor SB 203580 (10 μM) before exposure to 450 mOsm medium or EGF (5 ng/mL). Cell extracts were subjected to Western blot analysis with anti–p-p38. Membranes were then stripped and reprobed for total p38 (t-p38) using anti–t-p38 antibody. Results are summarized in bar graphs and expressed in mean ± SEM (n = 3). *P < 0.01 vs. untreated control. **P < 0.01 vs. treated with 450 mOsm medium alone.
Figure 5.
Figure 5.
Hypertonicity stimulation of IκB-α phosphorylation in tonicity and in a time-dependent manner. (A) Cells were exposed to 300, 375, and 450 mOsm media for 1 hour. Specificity of IκB-α phosphorylation was validated with pretreatment of NF-κB inhibitor PDTC (50 μM) before exposure to 450 mOsm medium. (B) Cells were exposed to 450 mOsm medium for 0, 5, 30, 60, and 120 minutes. Cell extracts were subjected to Western blot analysis for phosphorylated IκB-α (p-IκB-α) with anti–p-IκB-α antibody. Membranes were then stripped and reprobed for β-actin using anti–β-actin antibody to validate load equivalence.
Figure 6.
Figure 6.
Effects of modulation of TRPV1, EGFR, ERK, and p38 on hypertonicity-induced IκB-α phosphorylation. Cells were pretreated for 30 minutes with capsazepine (10 μM), AG 1478 (10 μM), PD 98059 (10 μM), or SB 203580 (10 μM) before exposure to 450 mOsm medium or EGF (5 ng/mL). Cell extracts were probed for p-IκB-α by Western blot analysis. Membranes were then stripped and reprobed for β-actin using anti–β-actin antibody. Results were summarized in bar graphs and expressed as mean ± SEM (n = 3). *P < 0.01 vs. untreated control. **P < 0.01 vs. treated with 450 mOsm medium alone.
Figure 7.
Figure 7.
Effects of TRPV1, EGFR, ERK, p38, and NF-κB inhibition on hypertonicity-induced increases in IL-6 and IL-8 release. Cells were pretreated for 30 minutes with capsazepine (10 μM), AG 1478 (10 μM), PD 98059 (10 μM), SB 203580 (10 μM), or NF-κB inhibitor PDTC (50 μM) before exposure to 450 mOsm medium. After 24 hours' incubation, supernatants were collected and analyzed for IL-6 (A) and IL-8 (B) using ELISA. Results were normalized to sample protein concentrations (picogram per milligram protein lysates) and summarized in bar graphs expressed as mean ± SEM (n = 3). *P < 0.05 vs. untreated control. **P < 0.05 vs. treated control with 450 mOsm medium alone.
Figure 8.
Figure 8.
Signaling pathways mediating hypertonicity stimulated increases in IL-6 and IL-8. Hypertonic stress activated the TRPV1 channel. TRPV1 stimulation leads to the transactivation of EGFR through MMP-dependent HB-EGF shedding, followed by MAPK and NF-κB activation and to EGFR-independent NF-κB stimulation. Activated NF-κB translocates to nucleus and promotes the production of IL-6 and IL-8.

Similar articles

Cited by

References

    1. Luo L, Li DQ, Corrales RM, Pflugfelder SC. Hyperosmolar saline is a proinflammatory stress on the mouse ocular surface. Eye Contact Lens. 2005;31:186–193 - PubMed
    1. Tomlinson A, Khanal S, Ramaesh K, Diaper C, McFadyen A. Tear film osmolarity: determination of a referent for dry eye diagnosis. Invest Ophthalmol Vis Sci. 2006;47:4309–4315 - PubMed
    1. Gilbard JP, Kenyon KR. Tear diluents in the treatment of keratoconjunctivitis sicca. Ophthalmology. 1985;92:646–650 - PubMed
    1. Papa V, Aragona P, Russo S, Di Bella A, Russo P, Milazzo G. Comparison of hypotonic and isotonic solutions containing sodium hyaluronate on the symptomatic treatment of dry eye patients. Ophthalmologica. 2001;215:124–127 - PubMed
    1. Alessandri-Haber N, Yeh JJ, Boyd AE, et al. Hypotonicity induces TRPV4-mediated nociception in rat. Neuron. 2003;39:497–511 - PubMed

Publication types

MeSH terms