. 2010 Nov;299(5):E772-85.
doi: 10.1152/ajpendo.00199.2010. Epub 2010 Aug 24.

Glucose-induced ERM protein activation and translocation regulates insulin secretion

Affiliations

Glucose-induced ERM protein activation and translocation regulates insulin secretion

James P Lopez et al. Am J Physiol Endocrinol Metab. 2010 Nov.

Abstract

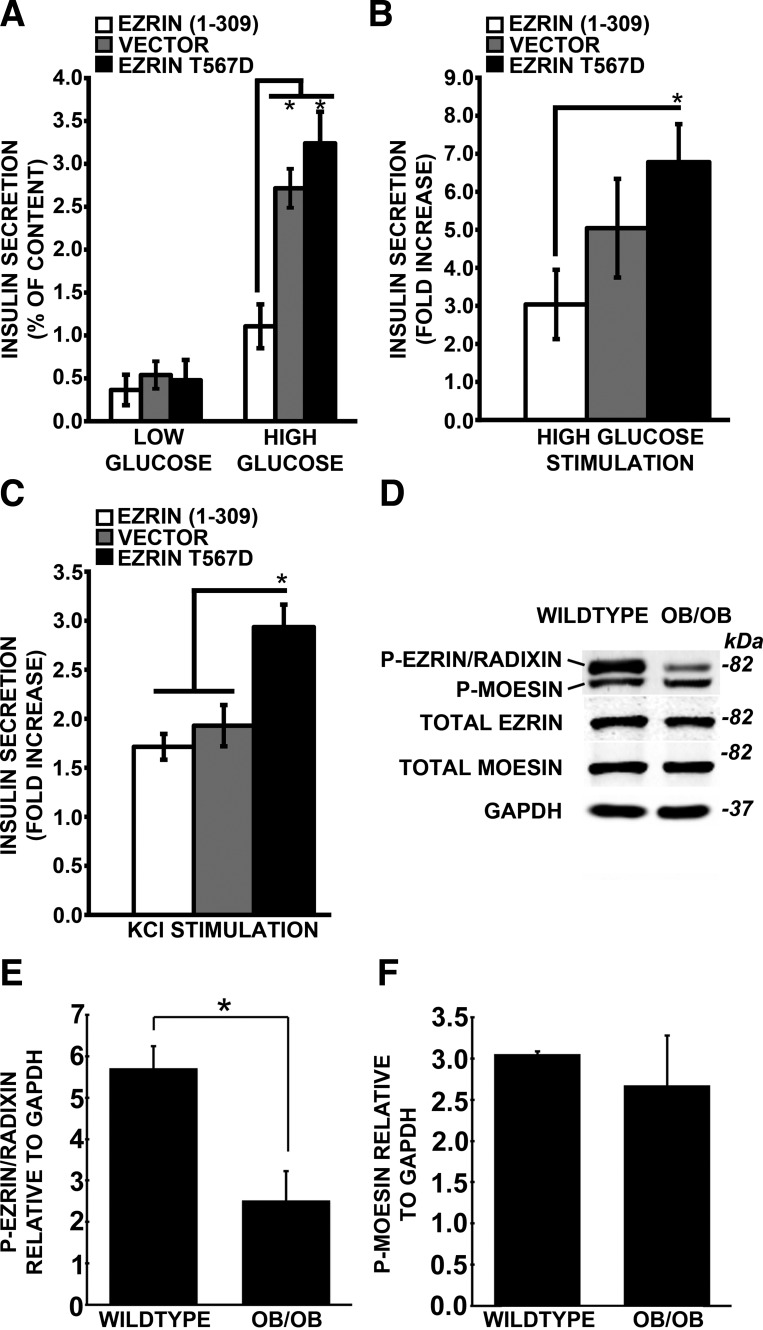
A key step in regulating insulin secretion is insulin granule trafficking to the plasma membrane. Using live-cell time-lapse confocal microscopy, we observed a dynamic association of insulin granules with filamentous actin and PIP2-enriched structures. We found that the scaffolding protein family ERM, comprising ezrin, radixin, and moesin, are expressed in β-cells and target both F-actin and PIP2. Furthermore, ERM proteins are activated via phosphorylation in a glucose- and calcium-dependent manner. This activation leads to a translocation of the ERM proteins to sites on the cell periphery enriched in insulin granules, the exocyst complex docking protein Exo70, and lipid rafts. ERM scaffolding proteins also participate in insulin granule trafficking and docking to the plasma membrane. Overexpression of a truncated dominant-negative ezrin construct that lacks the ERM F-actin binding domain leads to a reduction in insulin granules near the plasma membrane and impaired secretion. Conversely, overexpression of a constitutively active ezrin results in more granules near the cell periphery and an enhancement of insulin secretion. Diabetic mouse islets contain less active ERM, suggestive of a novel mechanism whereby impairment of insulin granule trafficking to the membrane through a complex containing F-actin, PIP2, Exo70, and ERM proteins contributes to defective insulin secretion.


Figures

Fig. 1.
Fig. 1.
Insulin granules have a time-depedent association with F-actin in MIN6 cells. A: Lifeact-GFP (red) and human insulin C-peptide-Cherry (green) were cotransfected into MIN6 cells and imaged using confocal techniques in low glucose (2 mM). B: time lapse 2-D image stacks of Lifeact-GFP (red) and human insulin C-peptide-Cherry (green) were analyzed using Imaris software to track insulin granules and F-actin dynamics over time (see materials and methods). C: association of insulin granules with F-actin was quantified and presented as the mean Lifeact-GFP fluorescence along an insulin granule trajectory over time. Shown are 4 representative insulin granule tracking results also shown in the “Imaris Tracks” panel in B. An increase in Lifeact-GFP fluorescence is indicative of an increase in insulin granule association with F-actin. D: 3-D confocal imaging of MIN6 cells expressing Lifeact-GFP (red) and human insulin C-peptide-Cherry (green). Optical z-slice stacks are presented as maximum projections and orthogonal slices as indicated. Arrows indicate insulin granules residing between the cortical F-actin layer and the plasma membrane. Scale bar, 5 and 10 μm, as indicated.
Fig. 2.
Fig. 2.
Direct visualization of dynamic interactions between PIP2 and insulin granules, and PIP2 is F-actin regulated in β-cells. A: MIN6 cells were cotransfected with GFP-PHD (red) and human insulin C-peptide-Cherry (green). Time lapse confocal imaging was performed on double positive cells. A representative time point from a representative time series is shown. Arrows indicated areas of interaction between PIP2 and insulin granules. Scale bar, 5μm; zoom box, 25 μm2. B: insulin granules were fitted to spots, and these spots and GFP-PHD were tracked in Imaris software. Four representative insulin granule displacements are shown in the “Imaris Tracks” panel. C: quantification of GFP-PHD fluorescence signal in relation to insulin granule tracks for the 4 representative displacements shown in B. An increase in mean GFP-PHD fluorescence is indicative of an increase in insulin granule association with PIP2. D: maximum projections of MIN6 cells expressing GFP-PHD before and after treatment with 1 μM latrunculin A for 15 min, demonstrating effect of F-actin depolymerization on PIP2 distribution. Scale bar, 10 μm; n = 6.
Fig. 3.
Fig. 3.
ERM (ezrin, radixin, and moesin) proteins are expressed in pancreatic islets and MIN6 cells and target F-actin and PIP2. A: ERM proteins were detected in mouse islets and MIN6 cells by SDS-PAGE immunoblotting with antibodies against ezrin, radixin, and moesin, resulting in bands corresponding to the expected size of ∼80 kDa. B: ERM mRNA expression relative to ezrin in pancreatic islets and MIN6 cells as determined by qRT-PCR (n = 3). C: expression of radixin-Cherry in MIN6 cells with Alexa 488-conjugated phalloidin labeling of F-actin. Confocal images are shown through the midplane and bottom of the cell at the cell-glass interface. D: colocalization of mouse amino-terminal PIP2 binding domain of ezrin [ezrin-(1-309)] fused to Cherry and GFP-PHD in MIN6 cells. Representative images shown. Scale bar, 5 μm.
Fig. 4.
Fig. 4.
ERM proteins are phosphorylated in islets and MIN6 cells in response to glucose stimulation in a calcium-dependent manner. Islets (A) and MIN6 cells (C) contain significantly more phosphorylated ezrin (top), radixin (middle), and moesin (bottom) (Thr567, Thr564, Thr558 respectively) relative to total ezrin following 10 min of high glucose stimulation [islets 14 mM glucose, MIN6 cells 20 mM glucose (n = 3)]. Representative blots shown. Bands correspond to expected molecular mass of these proteins at ∼80 kDa. Inhibition of L-type calcium channels with 1 μM nifedipine reduces phosphorylated ERM (n = 3) in the presence of high glucose in islets and MIN6 cells. Quantitation of blots is presented in B for islets and D for MIN6 cells. For B and D, *P < 0.05 comparing bar 1 with bar 2; #P < 0.05 comparing bar 2 with bar 3. Representative calcium traces in pancreatic islets (E) and MIN6 cells (F) stimulated with high glucose for 10 min (red squares), with high glucose and 1 μM nifedipine (blue circles), or maintained in low glucose (2 mM; green triangles). G: MIN6 cells were treated with high glucose (20 mM), high glucose with nifedipine (1 μM), or maintained in low glucose (2 mM); subsequently immunofluorescence was performed for detection of phosphorylated ERM. Representative images are shown. Scale bar, 10 μm.
Fig. 5.
Fig. 5.
ERM proteins translocate in response to glucose stimulation, and associate with F-actin in β-cells. A: live MIN6 cells expressing radixin-Cherry were stimulated with 20 mM glucose and images were acquired 1 per minute. Representative images at 0, 1, 4, 10, and 15 min following glucose stimulation are shown (scale bar, 5 μm). Maximal translocation of radixin-Cherry from the cytoplasm to the cell periphery/F-actin occurred between 4 and 10 min following glucose stimulation as determined by fluorescence line scans. B: MIN6 cells expressing ezrin-Cherry were stimulated with 20 mM glucose for 10 or 60 min or maintained in 2 mM glucose and subsequently fixed. F-actin was labeled with Alexa 488-conjugated phalloidin. Scale bar, 5 μm. C: ezrin-T567D-Cherry failed to translocate in response to glucose (20 mM for 10 min) in MIN6 cells. Scale, 5 μm.
Fig. 6.
Fig. 6.
Insulin granules associate at the periphery of active ERM proteins, and ERM proteins target lipid rafts and Exo70 in MIN6 cells. A: live MIN6 cells were cotransfected with human insulin C-peptide-GFP (green) and mouse ezrin-T567D-Cherry, radixin-T564D-Cherry, and ezrin-(1-309)-Cherry (red) and imaged using confocal technique. Arrows indicate sites of peripheral association between insulin granules and ERM mutants. Scale bar, 5 μm. B: live MIN6 cells expressing ezrin-(1-309)-Cherry (red) were stained with BODIPY-GM1 (green). Areas of colocalization are indicated by arrows. Confocal micrographs, scale bar, 5 μm. C: MIN6 cells expressing Exo70-GFP (green) were imaged by confocal microscopy and displayed punctuate targeting at the membrane. D: live MIN6 cells cotransfected with Exo70-GFP (green) and ezrin-Cherry (red) were imaged by confocal microscopy. Arrows indicate regions of colocalization. Scale bar, 5 μm.
Fig. 7.
Fig. 7.
Exo70 targets both PIP2 and F-actin in β-cells and associates with a subset of insulin granules. A: Exo70-GFP (green) and mouse ezrin-(1-309)-Cherry (red), the PIP2 binding domain of ezrin, were cotransfected into MIN6 cells and images acquired with confocal technique. Arrows indicate regions enriched in Exo70-GFP and the amino terminus of ezrin. Scale bar, 5 μm. B: F-actin in MIN6 cells expressing Exo70-GFP (green) was labeled with Texas Red X-conjugated phalloidin (red) and subsequently imaged. Arrows indicate regions enriched in Exo70 and F-actin. Scale bar, 5 μm. C: Exo70-GFP (green) and human insulin C-peptide-Cherry (red) were cotransfected into MIN6. Arrows indicate regions of association between Exo70-GFP and insulin granules. Scale bar, 5 μm.
Fig. 8.
Fig. 8.
ERM mutants disturb insulin granule distribution but do not affect F-actin or PIP2 distribution. MIN6 cells were cotransfected with human insulin C-peptide-GFP (green) and ezrin-(1-309)-Cherry (red; A) or ezrin-T567D-Cherry (red; C). Transfected cells were imaged by serial z-stack confocal microscopy, and insulin granules and ezrin mutants were transformed and 3-D rendered in Imaris (B and D) (see materials and methods). Distances from spots (granules) to surfaces (ezrin mutants) were quantified in Imaris and presented as histogram of pooled distances from spots to surface (in %; E), pooled percentage of granules within 0.5 μm of the surface (F), and as mean a distance of insulin granules to the surface (±SE, mean of 4 independent experiments, t-test <0.05; G). F-actin distribution with ezrin mutants was examined by Lifeact-GFP (green) cotransfected with ezrin-T567D-Cherry (red; H) or ezrin-(1-309)-Cherry (red; I) by 2-D confocal imaging. PIP2 distribution was imaged following coexpression of GFP-PHD (green) with ezrin-T567D-Cherry (red; J) or ezrin-(1-309)-Cherry (red; K) and presented as maximum projections of confocal z-stack images. Scale bars, 10 μm.
Fig. 9.
Fig. 9.
Insulin secretion is modulated by ERM activity. MIN6 cells stably transfected with human ezrin-(1-309)-VSV-G and human ezrin-T567D-VSV-G were assessed for insulin-secretory function by mouse ultrasensitive ELISA. MIN6 cells stably expressing truncated ezrin-(1-309)-VSV-G and ezrin-T567D-VSV-G were stimulated for 90 min with high glucose (20 mM) or maintained in low glucose (2 mM) and compared with vector control stable cells and expressed as percent insulin secretion (A) or fold increase (B) in insulin secretion from low glucose to high glucose (n = 3–6 ANOVA and post hoc Tukey's test: *P < 0.05). C: insulin secretion was also assessed in response to high potassium stimulation (30 mM for 15 min) in ezrin mutant stable cells and expressed as fold increase in secretion (n = 3–6, ANOVA and post hoc Tukey's test: P < 0.05). D: freshly isolated islets from ob/ob mice and lean control mice were analyzed by immunoblotting with antibodies against phosphorylated ERM, total ezrin, total moesin, and GAPDH (as a loading control) (n = 4 from 7 ob/ob and 7 control mice). Representative blots shown. Relative abundance of phosphorylated ezrin/radixin relative to GAPDH and phosphorylated moesin relative to GAPDH was quantified in E and F, respectively. Two-way t-test: *P < 0.05.

Similar articles

Cited by

References

    1. Algrain M, Turunen O, Vaheri A, Louvard D, Arpin M. Ezrin contains cytoskeleton and membrane binding domains accounting for its proposed role as a membrane-cytoskeletal linker. J Cell Biol 120: 129–139, 1993. - PMC - PubMed
    1. Amieva MR, Litman P, Huang L, Ichimaru E, Furthmayr H. Disruption of dynamic cell surface architecture of NIH3T3 fibroblasts by the N-terminal domains of moesin and ezrin: in vivo imaging with GFP fusion proteins. J Cell Sci 112: 111–125, 1999. - PubMed
    1. Barret C, Roy C, Montcourrier P, Mangeat P, Niggli V. Mutagenesis of the phosphatidylinositol 4,5-bisphosphate (PIP2) binding site in the NH2-terminal domain of ezrin correlates with its altered cellular distribution. J Cell Biol 151: 1067–1080, 2000. - PMC - PubMed
    1. Bittner MA, Holz RW. Phosphatidylinositol-4,5-bisphosphate: actin dynamics and the regulation of ATP-dependent and -independent secretion. Mol Pharmacol 67: 1089–1098, 2005. - PubMed
    1. Boyd C, Hughes T, Pypaert M, Novick P. Vesicles carry most exocyst subunits to exocytic sites marked by the remaining two subunits, Sec3p and Exo70p. J Cell Biol 167: 889–901, 2004. - PMC - PubMed

Publication types