

Impact of viral-mediated IGF-I gene transfer on skeletal muscle following cast immobilization
- PMID: 20739512
- PMCID: PMC2980362
- DOI: 10.1152/ajpendo.00230.2010
Impact of viral-mediated IGF-I gene transfer on skeletal muscle following cast immobilization
Abstract
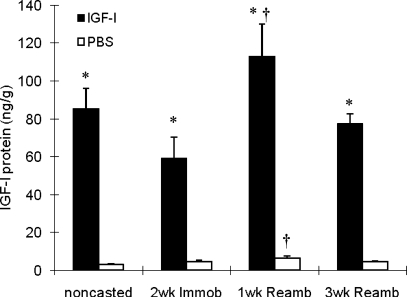
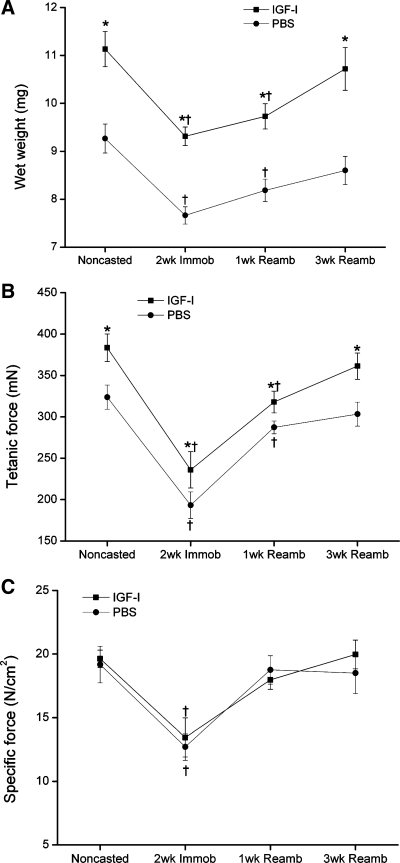
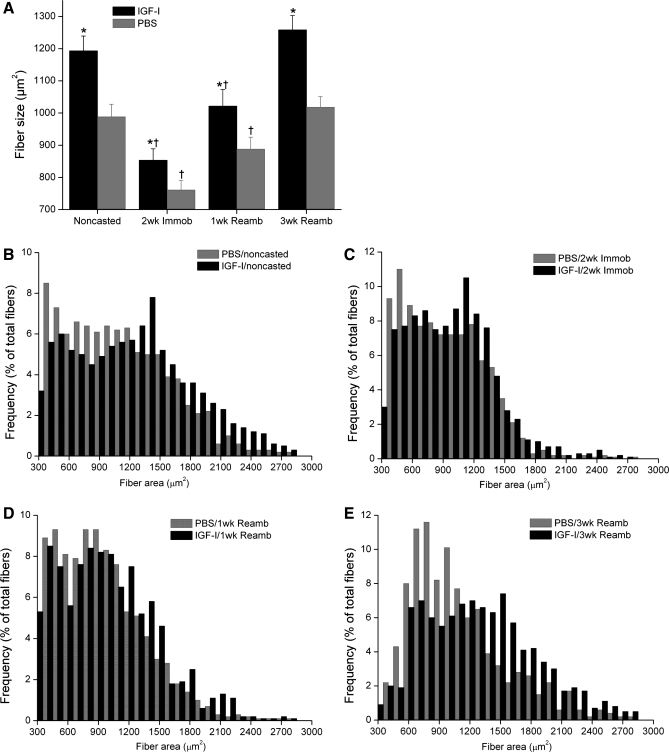
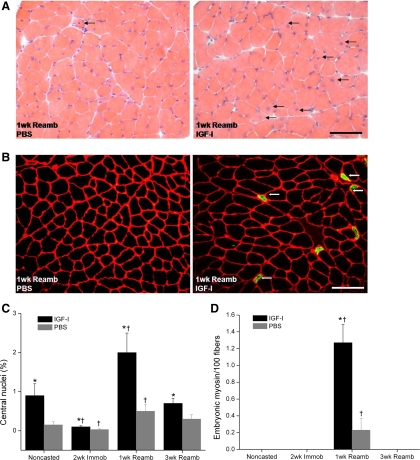
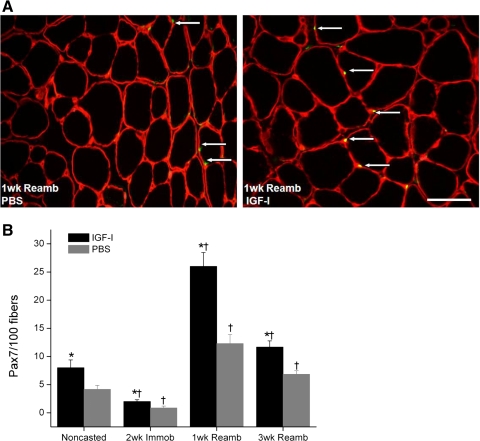
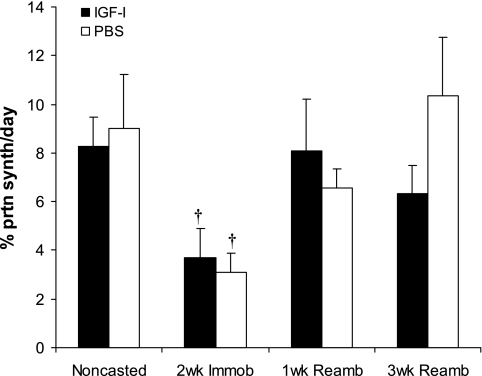
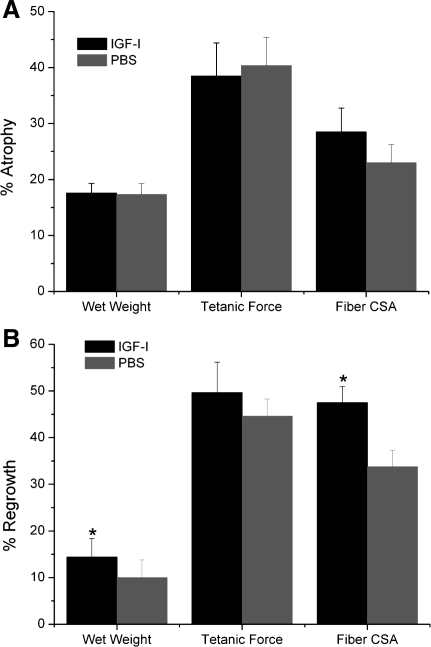
Insulin-like growth factor I (IGF-I) is a potent myogenic factor that plays a critical role in muscle regeneration and muscle hypertrophy. The purpose of this study was to evaluate the effect of IGF-I overexpression on the recovery of muscle size and function during reloading/reambulation after a period of cast immobilization in predominantly fast twitch muscles. In addition, we investigated concomitant molecular responses in IGF-I receptor and binding proteins (BPs). Recombinant adeno-associated virus vector for IGF-I (rAAV-IGF-IA) was injected into the anterior compartment of one of the hindlimbs of young (3 wk) C57BL6 female mice. At 20 wk of age, both hindlimbs were cast immobilized in a shortened position for 2 wk to unload the tibialis anterior (TA) and extensor longus digitorum (EDL) muscles. The TA and EDL muscles were removed bilaterally after 2 wk of cast immobilization and after 1 and 3 wk of free cage reambulation. Increases in IGF-I mRNA and protein levels with IGF-I overexpression were associated with significant increases in muscle wet weight, fiber size, and tetanic force, although overexpression did not protect against cast immobilization-induced muscle atrophy. After 1 wk of reambulation, evidence of enhanced muscle regeneration was noted in IGF-I-overexpressing muscles with an increased prevalence of central nuclei, embryonic myosin, and Pax7 positive fibers. We also observed larger relative gains in muscle size (wet weight and fiber area), but not force, during the 3-wk reambulation period in hindlimb muscles overexpressing IGF-I compared with contralateral control legs. Changes in IGFBP-5 mRNA expression during cast immobilization and reambulation paralleled those of IGF-I, whereas IGFBP-3 expression changed inversely to IGFBP-5.
Figures
Similar articles
-
Overexpression of insulin-like growth factor-1 attenuates skeletal muscle damage and accelerates muscle regeneration and functional recovery after disuse.Exp Physiol. 2013 May;98(5):1038-52. doi: 10.1113/expphysiol.2012.070722. Epub 2013 Jan 4. Exp Physiol. 2013. PMID: 23291913 Free PMC article.
-
Mature IGF-I excels in promoting functional muscle recovery from disuse atrophy compared with pro-IGF-IA.J Appl Physiol (1985). 2014 Apr 1;116(7):797-806. doi: 10.1152/japplphysiol.00955.2013. Epub 2013 Dec 26. J Appl Physiol (1985). 2014. PMID: 24371018 Free PMC article.
-
One week, but not 12 hours, of cast immobilization alters promotor DNA methylation patterns in the nNOS gene in mouse skeletal muscle.J Physiol. 2019 Nov;597(21):5145-5159. doi: 10.1113/JP277019. Epub 2019 Oct 9. J Physiol. 2019. PMID: 31490543
-
Modulation of insulin-like growth factor (IGF)-I and IGF-binding protein interactions enhances skeletal muscle regeneration and ameliorates the dystrophic pathology in mdx mice.Am J Pathol. 2007 Oct;171(4):1180-8. doi: 10.2353/ajpath.2007.070292. Epub 2007 Sep 6. Am J Pathol. 2007. PMID: 17823291 Free PMC article.
-
Insulin-like growth factors and insulin-like growth factor binding proteins in the endometrium. Effect of intrauterine levonorgestrel delivery.Hum Reprod. 2000 Aug;15 Suppl 3:173-81. doi: 10.1093/humrep/15.suppl_3.173. Hum Reprod. 2000. PMID: 11041233 Review.
Cited by
-
The pro-forms of insulin-like growth factor I (IGF-I) are predominant in skeletal muscle and alter IGF-I receptor activation.Endocrinology. 2013 Mar;154(3):1215-24. doi: 10.1210/en.2012-1992. Epub 2013 Feb 13. Endocrinology. 2013. PMID: 23407451 Free PMC article.
-
Transcriptional regulation of myotrophic actions by testosterone and trenbolone on androgen-responsive muscle.Steroids. 2014 Sep;87:59-66. doi: 10.1016/j.steroids.2014.05.024. Epub 2014 Jun 10. Steroids. 2014. PMID: 24928725 Free PMC article.
-
Skeletal muscle wasting with disuse atrophy is multi-dimensional: the response and interaction of myonuclei, satellite cells and signaling pathways.Front Physiol. 2014 Mar 17;5:99. doi: 10.3389/fphys.2014.00099. eCollection 2014. Front Physiol. 2014. PMID: 24672488 Free PMC article. Review.
-
Role of IGF-I signaling in muscle bone interactions.Bone. 2015 Nov;80:79-88. doi: 10.1016/j.bone.2015.04.036. Bone. 2015. PMID: 26453498 Free PMC article. Review.
-
Delayed recovery of skeletal muscle mass following hindlimb immobilization in mTOR heterozygous mice.PLoS One. 2012;7(6):e38910. doi: 10.1371/journal.pone.0038910. Epub 2012 Jun 22. PLoS One. 2012. PMID: 22745686 Free PMC article.
References
-
- Adams GR. Role of insulin-like growth factor-I in the regulation of skeletal muscle adaptation to increased loading. Exerc Sport Sci Rev 26: 31–60, 1998 - PubMed
-
- Adams GR, Caiozzo VJ, Haddad F, Baldwin KM. Cellular and molecular responses to increased skeletal muscle loading after irradiation. Am J Physiol Cell Physiol 283: C1182–C1195, 2002 - PubMed
-
- Adams GR, Haddad F. The relationships among IGF-1, DNA content, and protein accumulation during skeletal muscle hypertrophy. J Appl Physiol 81: 2509–2516, 1996 - PubMed
-
- Adams GR, McCue SA. Localized infusion of IGF-I results in skeletal muscle hypertrophy in rats. J Appl Physiol 84: 1716–1722, 1998 - PubMed
-
- Andress DL, Birnbaum RS. Human osteoblast-derived insulin-like growth factor (IGF) binding protein-5 stimulates osteoblast mitogenesis and potentiates IGF action. J Biol Chem 267: 22467–22472, 1992 - PubMed
Publication types
MeSH terms
Substances
Grants and funding
LinkOut - more resources
Full Text Sources
Other Literature Sources
Miscellaneous