. 2010 Nov;84(21):11089-100.
doi: 10.1128/JVI.01383-10. Epub 2010 Aug 25.

Pathogenesis and immune response of Crimean-Congo hemorrhagic fever virus in a STAT-1 knockout mouse model

Affiliations

Pathogenesis and immune response of Crimean-Congo hemorrhagic fever virus in a STAT-1 knockout mouse model

Dennis A Bente et al. J Virol. 2010 Nov.

Abstract

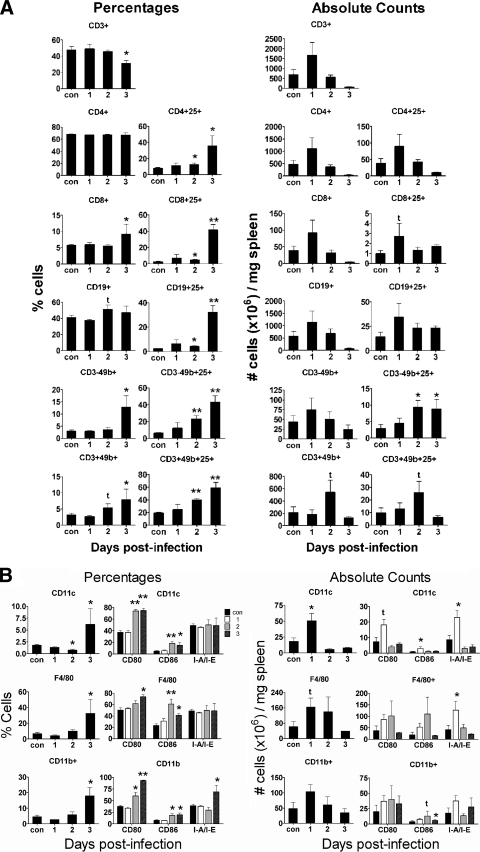
Tick-borne Crimean-Congo hemorrhagic fever virus (CCHFV) causes a severe hemorrhagic syndrome in humans but not in its vertebrate animal hosts. The pathogenesis of the disease is largely not understood due to the lack of an animal model. Laboratory animals typically show no overt signs of disease. Here, we describe a new small-animal model to study CCHFV pathogenesis that manifests clinical disease, similar to that seen in humans, without adaptation of the virus to the host. Our studies revealed that mice deficient in the STAT-1 signaling molecule were highly susceptible to infection, succumbing within 3 to 5 days. After CCHFV challenge, mice exhibited fever, leukopenia, thrombocytopenia, and highly elevated liver enzymes. Rapid viremic dissemination and extensive replication in visceral organs, mainly in liver and spleen, were associated with prominent histopathologic changes in these organs. Dramatically elevated proinflammatory cytokine levels were detected in the blood of the animals, suggestive of a cytokine storm. Immunologic analysis revealed delayed immune cell activation and intensive lymphocyte depletion. Furthermore, this study also demonstrated that ribavirin, a suggested treatment in human cases, protects mice from lethal CCHFV challenge. In conclusion, our data demonstrate that the interferon response is crucial in controlling CCHFV replication in this model, and this is the first study that offers an in-depth in vivo analysis of CCHFV pathophysiology. This new mouse model exhibits key features of fatal human CCHF, proves useful for the testing of therapeutic strategies, and can be used to study virus attenuation.


Figures

FIG. 1.
FIG. 1.
Survival and clinical parameters following CCHFV challenge. (A) Survival curve of STAT129 mice challenged with serial dilutions of CCHFV. Adult STAT129 mice (n = 6 per group) were challenged intraperitoneally with 1,000 PFU (purple), 100 PFU (pink), 10 PFU (orange), 1 PFU (green), or 0.1 PFU (blue) of CCHFV IbAr 10200. Animals succumbed to disease between day 3 and day 5 postinfection. Geometric mean time to death (GMD) was calculated in days. The median lethal dose was 4 PFU. WT129 mice challenged with CCHFV did not succumb to infection (data not shown). (B) Body temperature and weight changes throughout the course of infection. Body temperature (green) and weight change (blue) were monitored over 5 days in STAT129 mice challenged with 100 PFU of CCHFV IbAr 10200 intraperitoneally (n = 12 ± standard error of the mean). Mice succumbed to disease on day 4 postinfection. Average temperature of mock-infected STAT129 mice (dotted line, n = 12) was 36.53°C ± 0.53°C (standard deviation). STAT129 mice challenged with CCHFV showed a highly significant increase in body temperature on day 2 postinfection compared to that of mock-infected mice. Body temperature then dropped to 35.21°C ± 1.14°C on day 3 postinfection, but the difference from the temperature of mock-infected mice was not statistically significant (P = 0.223). Mice had lost 7.05% ± 0.72% weight at 3 dpi and 12.43% ± 1.15% on day 4. There was no weight loss or rise in temperature in mock-infected STAT129 or CCHFV-infected WT129 mice (data not shown). (C to F) Hematology and clinical chemistry of CCHFV-infected animals: liver transaminase ALT (C), white blood cell counts (D), platelet counts (E), and hematocrit (F) were measured on days 1, 2, and 3 postinfection in infected and mock-infected (control) animals (means ± standard errors). No significant variation was detected in mock-infected animals; therefore, the results at the 3 time points were pooled (controls). Infected STAT129 mice showed a significant drop in white blood cell counts and platelets on day 2 postinfection compared to the results for the control animals. Hematocrit (F) remained stable throughout the course of infection. Serum levels of liver transaminase ALT (C) increased 10-fold on day 3 compared to the levels in mock-infected animals. The two-tailed P values are indicated as follows: *, P ≤ 0.05; **, P ≤ 0.01; ***, P ≤ 0.001.
FIG. 2.
FIG. 2.
Viremia levels and tissue titers. STAT129 mice and WT129 mice were inoculated intraperitoneally with 100 PFU of CCHFV IbAr 10200. Virus was detected and quantified in whole blood and organs on days 1, 2, and 3 postinfection by quantitative real-time RT-PCR using a recombinant RNA standard for absolute quantification and reported as genome equivalents (GEQ). (A) Viral load in whole blood was determined. Virus was detected in CCHFV-infected STAT129 mice (n = 5 for each time point) on days 1, 2, and 3 postinfection (mean + standard error). In WT129 mice, CCHFV was detected on day 1 postinfection. Virus levels in samples on days 2 and 3 dpi were below the detection limit (dot-dash line; 3 × 10² GEQ/ml). (B) Virus titers were measured in tissues. Liver, spleen, lung, kidney, and brain of infected STAT129 mice and WT129 mice (n = 5 for each tissue) were harvested on days 1, 2, and 3 postinfection. Genome equivalents were normalized to 1 μg of RNA for each tissue by quantitative real-time RT-PCR targeting the housekeeping gene GAPDH. All samples were below the detection limit (dot-dash line; 2.5 × 10² GEQ/μg) on day 1.
FIG. 3.
FIG. 3.
Gross pathology findings in STAT129 mice. (A) In situ picture of organs in CCHFV-infected animals (left) and mock-infected animals (right). Findings included intestinal hyperemia with injected blood vessels (white arrow) and serosal petechia on bladder (black arrow). No hemorrhaging was observed in any of the animals. (B and C) Liver (B) and spleen (C) of CCHFV-infected animals (left) were discolored compared to those of mock-infected animals (right).
FIG. 4.
FIG. 4.
Histopathologic changes were evident in liver and spleen of CCHFV-infected STAT129 mice. STAT129 mice were mock infected or inoculated intraperitoneally with 100 PFU of CCHFV IbAr 10200. Hematoxylin-and-eosin-stained sections of liver and spleen and IHC sections of liver of mice on day 3 postinfection are presented. Liver (A) and spleen (D) sections from mock-infected animals showed no histopathologic changes. The liver sections (B and C) showed multiple foci of hepatocellular necrosis. Original magnification was ×200 in panels A and B and ×630 in panel C. The spleen sections (E and F) showed prominent lymphocyte depletion and karyorrhectic debris. Original magnification was ×200 in panels D and E and ×630 in panel F. IHC assay was conducted with a polyclonal rabbit anti-CCHFV antibody. Negative control (G) showed no staining. Liver sections of infected animals (H and I) showed scattered granular staining (red) in foci of hepatocellular necrosis and occasional Kupffer cells (black arrows). Naphthol/fast red substrate with light hematoxylin counterstain were used; original magnification was ×200 in panels G and H and ×630 in panel I.
FIG. 5.
FIG. 5.
Changes in the leukocyte populations in the spleen during CCHFV infection. STAT129 mice were inoculated intraperitoneally with 100 PFU of CCHFV IbAr 10200. Spleens from mock-infected (control [con]) and CCHFV-infected mice were homogenized each day, and the various lymphocyte populations stained for immunophenotyping and activation levels and then analyzed by flow cytometry. The percentages and absolute counts for each population are shown. (A) Lymphocyte panel. (B) Macrophage and DC panel. Unpaired t tests were performed between the control samples and the infected samples on each day postinfection. Statistical symbols: *, P ≤ 0.05; **, P ≤ 0.001; t indicates a trend where P is between 0.05 and 0.10.
FIG. 6.
FIG. 6.
IFN-α, IFN-β, and proinflammatory cytokines are elevated in infected animals on days 2 and 3 postinfection. (A) IFN-α and IFN-β levels were determined in plasma of mock-infected STAT129 mice (white bars), CCHFV-infected WT129 mice (checkered bars), and CCHFV-infected STAT129 mice (striped bars) and reported as pg/ml (mean + standard error). Unpaired t tests were performed between the results for mock-infected STAT129 mice and those for infected STAT129 and WT129 mice on each day postinfection. (B) Proinflammatory cytokines were measured in plasma of mock-infected STAT129 mice, CCHFV-infected WT129 mice, and CCHFV-infected STAT129 mice and reported as pg/ml (mean + standard error). Results for IL-6, TNF, IFN-γ, CCL-2, IL-10, and IL-1β in mock-infected and infected STAT129 mice are shown here. GM-CSF, IL-2, IL-4, and IL-12(p70) were not significantly elevated. No significant variation was detected in mock-infected animals between each time point; therefore, the results for the 3 time points were pooled (controls). Unpaired t tests were performed between the results for controls and the results for infected animals on each day postinfection. CCHFV-infected WT129 mice showed no significant differences in proinflammatory cytokine levels compared to the results for mock-infected STAT129 mice (data not shown).
FIG. 7.
FIG. 7.
Ribavirin protection study. (A and B) STAT129 mice were challenged i.p. with 1,000 PFU (A) or 10 PFU (B) of CCHFV IbAr 10200. Six animals per group received PBS (positive control; red), ribavirin treatment A (100 mg/kg, 1 h postinfection and then daily; orange), or ribavirin treatment B (100 mg/kg 24 h postinfection and then daily; green). Blue marks results for animals receiving ribavirin treatment A but no CCHFV. (C to E) Results for ribavirin treatment group A challenged with 1,000 PFU: survivors (purple) versus nonsurvivors (green) versus no-treatment group (red). Body temperature (C), weight change (D), and clinical scoring (E) were compared.

Similar articles

Cited by

References

    1. Akinci, E., M. Yilmaz, H. Bodur, P. Onguru, F. N. Bayazit, A. Erbay, and G. Ozet. 2009. Analysis of lymphocyte subgroups in Crimean-Congo hemorrhagic fever. Int. J. Infect. Dis. 13:560-563. doi:10.1016/j.ijid.2008.08.027. - DOI - PubMed
    1. Akira, S. 1999. Functional roles of STAT family proteins: lessons from knockout mice. Stem Cells 17:138-146. doi:10.1002/stem.170138. - DOI - PubMed
    1. Andersson, I., H. Karlberg, M. Mousavi-Jazi, L. Martinez-Sobrido, F. Weber, and A. Mirazimi. 2008. Crimean-Congo hemorrhagic fever virus delays activation of the innate immune response. J. Med. Virol. 80:1397-1404. doi:10.1002/jmv.21222. - DOI - PubMed
    1. Andersson, I., A. Lundkvist, O. Haller, and A. Mirazimi. 2006. Type I interferon inhibits Crimean-Congo hemorrhagic fever virus in human target cells. J. Med. Virol. 78:216-222. doi:10.1002/jmv.20530. - DOI - PubMed
    1. Bereczky, S., G. Lindegren, H. Karlberg, S. Akerstrom, J. Klingstrom, and A. Mirazimi. 2010. Crimean-Congo hemorrhagic fever virus infection is lethal for adult type I interferon receptor-knockout mice. J. Gen. Virol. 91:1473-1477. doi:10.1099/vir.0.019034-0. - DOI - PubMed

Publication types

MeSH terms

Substances