Comparative Study
. 2010 Aug 25;30(34):11317-25.
doi: 10.1523/JNEUROSCI.1491-10.2010.

The NADPH oxidase NOX2 controls glutamate release: a novel mechanism involved in psychosis-like ketamine responses

Affiliations
Comparative Study

The NADPH oxidase NOX2 controls glutamate release: a novel mechanism involved in psychosis-like ketamine responses

Silvia Sorce et al. J Neurosci. .

Abstract

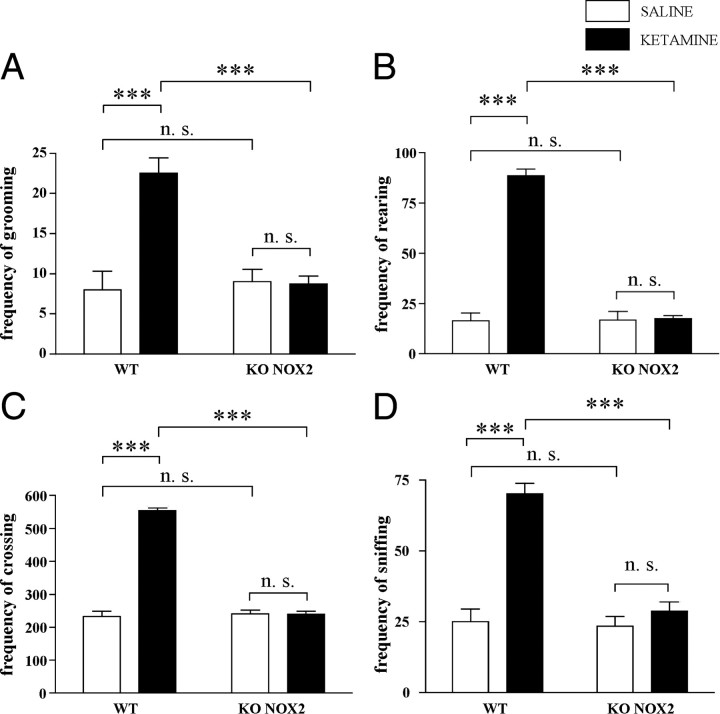
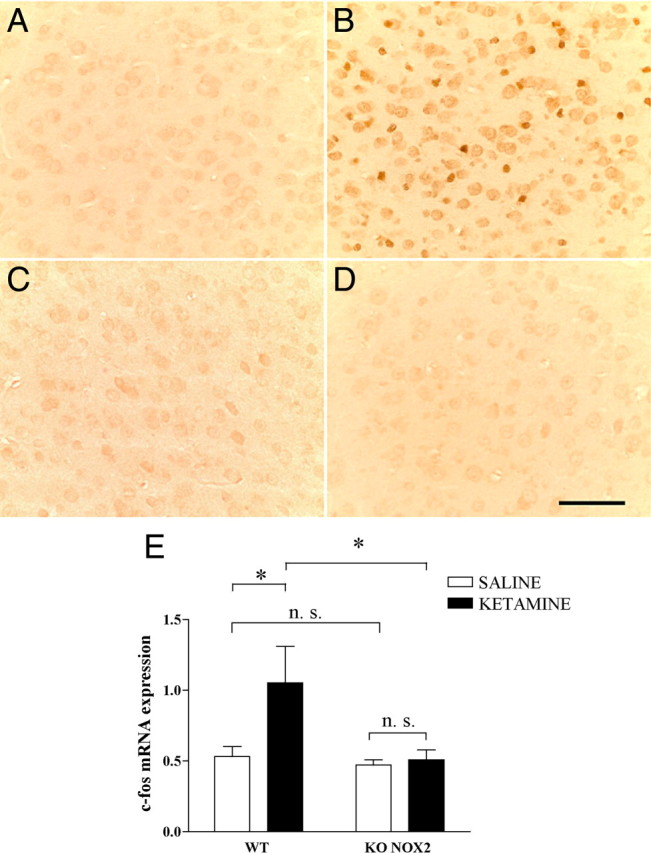
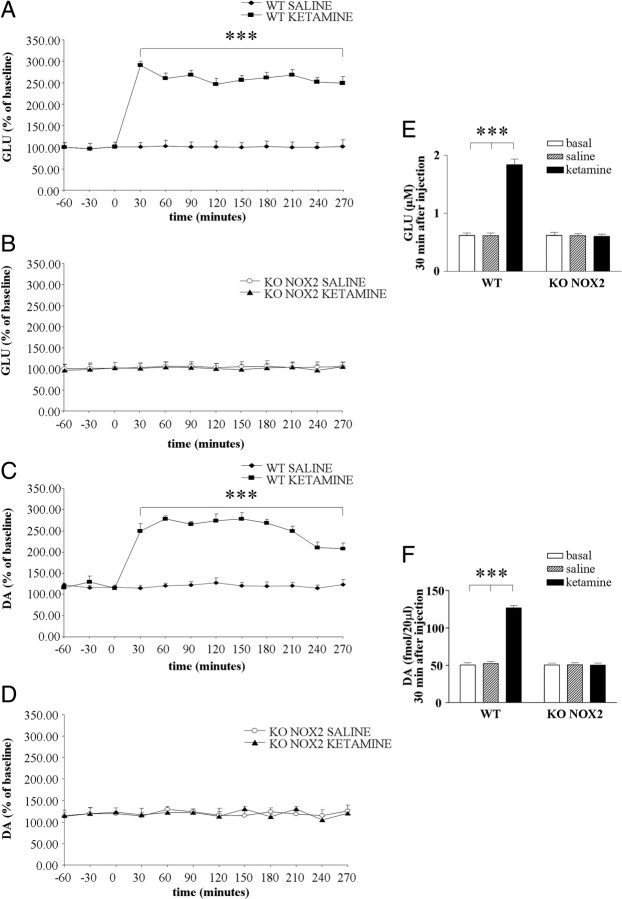
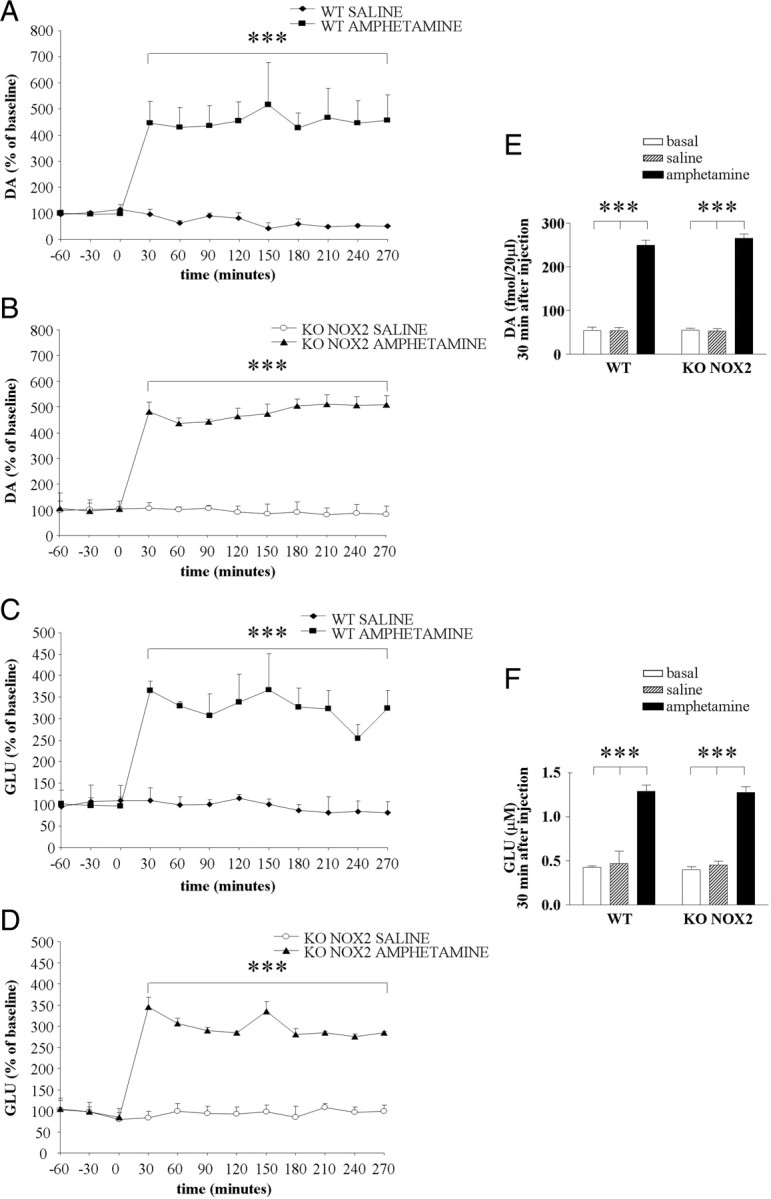
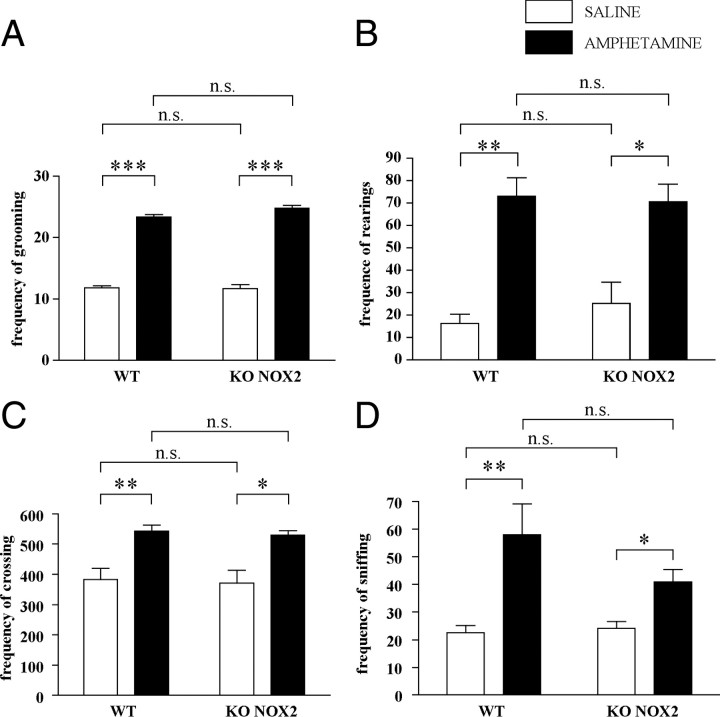
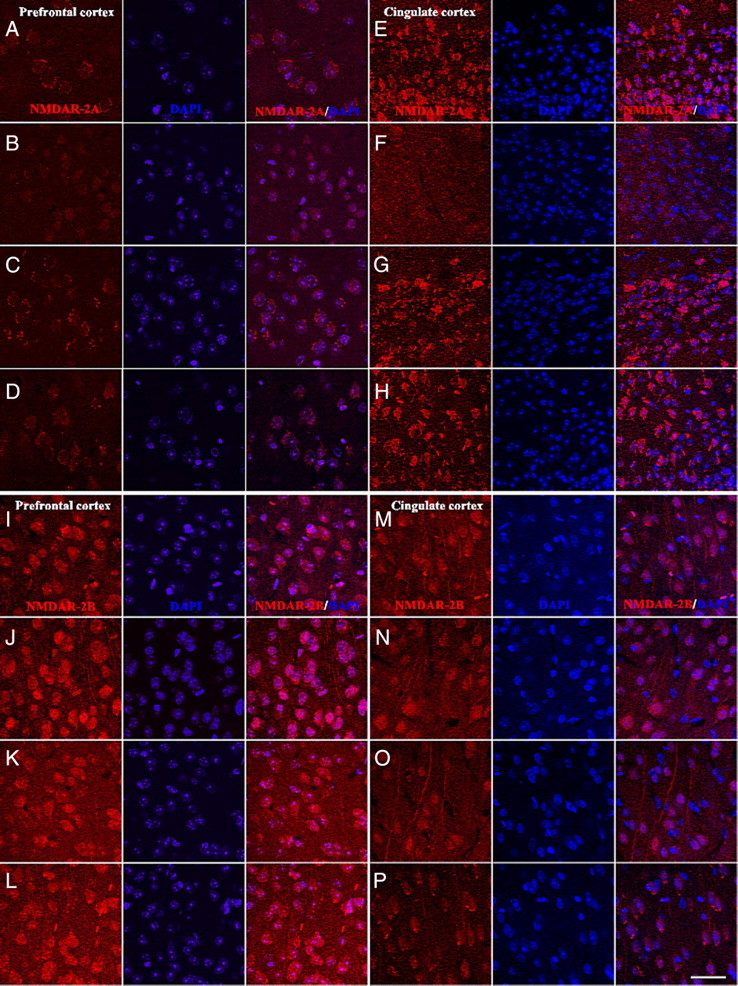
Subanesthetic doses of NMDA receptor antagonist ketamine induce schizophrenia-like symptoms in humans and behavioral changes in rodents. Subchronic administration of ketamine leads to loss of parvalbumin-positive interneurons through reactive oxygen species (ROS), generated by the NADPH oxidase NOX2. However, ketamine induces very rapid alterations, in both mice and humans. Thus, we have investigated the role of NOX2 in acute responses to subanesthetic doses of ketamine. In wild-type mice, ketamine caused rapid (30 min) behavioral alterations, release of neurotransmitters, and brain oxidative stress, whereas NOX2-deficient mice did not display such alterations. Decreased expression of the subunit 2A of the NMDA receptor after repetitive ketamine exposure was also precluded by NOX2 deficiency. However, neurotransmitter release and behavioral changes in response to amphetamine were not altered in NOX2-deficient mice. Our results suggest that NOX2 is a major source of ROS production in the prefrontal cortex controlling glutamate release and associated behavioral alterations after acute ketamine exposure. Prolonged NOX2-dependent glutamate release may lead to neuroadaptative downregulation of NMDA receptor subunits.


Figures

Figure 1.
Figure 1.
Behavioral alterations induced by ketamine exposure are prevented in NOX2-deficient mice. Thirty minutes after injection with ketamine (30 mg/kg, i.p.) or saline, mice were placed in the arena for open-field test. A–D, Bar graphs represent the frequency of grooming (A), rearing (B), crossing (C), and sniffing (D) recorded during the 20 min of the test in WT and KO NOX2 mice. For grooming: Ftreatment (tr) × Fgenotype (gen)(1,22) = 15.98, p < 0.001; Ftr(1,22) = 14.92, p < 0.001; Fgen(1,22) = 11.96, p < 0.01; not significant (NS): WT saline versus KO NOX2 saline, p = 0.742; KO NOX2 saline versus KO NOX2 ketamine, p = 0.928. For rearing: Ftr×gen(1,22) = 109.48, p < 0.001; Ftr(1,22) = 114.93, p < 0.001; Fgen(1,22) = 107.34, p < 0.001; NS: WT saline versus KO NOX2 saline, p = 0.950; KO NOX2 saline versus KO NOX2 ketamine, p = 0.864. For crossing: Ftr×gen(1,22) = 218.926, p < 0.001; Ftr(1,22) = 217.231, p < 0.001; Fgen(1,22) = 198.637, p < 0.001; NS: WT saline versus KO NOX2 saline, p = 0.669; KO NOX2 saline versus KO NOX2 ketamine, p = 0.970. For sniffing: Ftr×gen(1,22) = 23.76, p < 0.001; Ftr(1,22) = 38.26, p < 0.001; Fgen(1,22) = 27.63, p < 0.001. NS: WT saline versus KO NOX2 saline, p = 0.816; KO NOX2 saline versus KO NOX2 ketamine, p = 0.385. ***p < 0.001 WT ketamine versus WT saline and WT ketamine versus KO NOX2 ketamine using two-way ANOVA followed by Tukey's post hoc test (n = 5 WT saline; n = 9 WT ketamine; n = 4 KO NOX2 saline; n = 8 KO NOX2 ketamine).
Figure 2.
Figure 2.
Stress markers are increased after ketamine injections in wild-type mice, and not in NOX2-deficient mice. A–D, Representative images of immunohistochemistry staining for 8-OHdG in the prefrontal cortex of WT (A, B) or KO NOX2 (C, D) mice treated with saline (A, C) or ketamine (B, D). n = 5 per condition. Scale bar, 65 μm. E, Real-time PCR quantification of the immediate early gene c-fos mRNA in prefrontal cortex after ketamine or saline injection in WT and KO NOX2 mice. Ftr×gen(1,14) = 1.976, p = 0.182; Ftr(1,14) = 5.653, p < 0.05; Fgen(1,14) = 3.463, p < 0.05. NS: WT saline versus KO NOX2 saline, p = 0.503; KO NOX2 saline versus KO NOX2 ketamine, p = 0.385. *p < 0.05 WT ketamine versus WT saline and WT ketamine versus KO NOX2 ketamine using two-way ANOVA followed by Tukey's post hoc test (n = 5 WT saline; n = 4 WT ketamine; n = 4 KO NOX2 saline; n = 5 KO NOX2 ketamine).
Figure 3.
Figure 3.
Glutamate and dopamine level elevation is prevented in NOX2-deficient mice. A–D, Time-dependent effect of ketamine or saline injection on extracellular glutamate (GLU; A, B) and dopamine (DA; C, D) levels was determined by microdialysis in the prefrontal cortex of WT (A, C) and KO NOX2 (B, D) mice. Data are expressed as the percentage of baseline (as described in Materials and Methods). E, F, Concentration of glutamate (E) and dopamine (F) in WT and KO NOX2 mice at basal level or 30 min after saline or ketamine injection. ***p < 0.001 using two-way ANOVA for repeated measures followed by Tukey's post hoc test (n = 6 WT saline and ketamine; n = 4 KO NOX2 saline and ketamine). For glutamate analysis: two-way ANOVA for repeated measures in KO NOX2 saline versus KO NOX2 ketamine: Ftr(1,66) = 2.259, p = 0.184; Ftime (t)(11,66) = 1.882, p = 0.058; Ftr×t(11,66) = 0.568, p = 0.847; in WT ketamine versus KO NOX2 ketamine: Fgen(1,88) = 10268.736, p < 0.001; Ft(11,88) = 345.017, p < 0.001; Ft×gen(11,88) = 327.118, p < 0.001; in WT ketamine versus KO NOX2 saline: Ftr(1,88) = 7557.223, p < 0.001; Ft(11,88) = 358.748, p < 0.001; Ft×tr(11,88) = 329.535, p < 0.001; in WT saline versus KO NOX2 ketamine: Ftr(1,88) = 15.944, p = 0.004; Ft(11,88) = 2.118, p = 0.027; Ftr×t(11,88) = 0.551, p = 0.863; however, Tukey's post hoc test did not reveal any significant difference for treatment and time; in WT saline versus KO NOX2 saline: Fgen(1,88) = 0.00160, p = 0.969; Ft(11,88) = 2.011, p = 0.036; Fgen×t(11,88) = 0.443, p = 0.932; however, Tukey's post hoc test did not reveal any significant difference for genotype and time; in WT ketamine versus WT saline: Ftr(1,110) = 16,702.806, p < 0.001; Ft(11,110) = 529.138, p < 0.001; Ftr×t(11,110) = 505.459, p < 0.001. For dopamine analysis: two-way ANOVA for repeated measures in KO NOX2 saline versus KO NOX2 ketamine: Ftr(1,66) = 0.00525, p = 0.945; Ft(11,66) = 0.633, p = 0.749; Ftr×t(11,66) = 0.440, p = 0.932; in WT ketamine versus KO NOX2 saline: Ftr(1,88) = 360.147, p < 0.001; Ft(11,88) = 16.156, p < 0.001; Ft×tr(11,88) = 14.890, p < 0.001; in WT saline versus KO NOX2 ketamine: Ftr(1,88) = 0.00714, p = 0.935; Ft(11,88) = 0.480, p = 0.911; Ftr×t(11,88) = 0.37, p = 0.965; in WT saline versus KO NOX2 saline: Fgen(1,88) = 0.00000392, p = 0.998; Ft(11,88) = 0.31, p = 0.982; Fgen×t(11,88) = 0.234, p = 0.994; in WT ketamine versus WT saline: Ftr(1,110) = 530.505, p < 0.001; Ft(11,110) = 20.573, p < 0.001; Ftr×t(11,110) = 18.919, p < 0.001; WT ketamine versus KO NOX2 ketamine: Fgen(1,88) = 331.637, p < 0.001; Ft(11,88) = 16.311, p < 0.001; Ft×gen(11,88) = 15.508, p < 0.001.
Figure 4.
Figure 4.
Neurotransmitter level elevation is similar in wild-type and NOX2-deficient mice after amphetamine exposure. A–D, Time-dependent effect of amphetamine or saline injection on extracellular dopamine (DA; A, B) and glutamate (GLU; C, D) levels was determined by microdialysis in the prefrontal cortex of WT (A, C) and KO NOX2 (B, D) mice. Data are expressed as the percentage of baseline (as described in Materials and Methods). E, F, Concentration of dopamine (E) and glutamate (F) in WT and KO NOX2 mice at basal level or 30 min after saline or amphetamine injection. ***p < 0.001 using two-way ANOVA for repeated measures followed by Tukey's post hoc test (n = 4 WT saline; n = 4 WT amphetamine; n = 4 KO NOX2 saline; n = 4 KO NOX2 amphetamine). For dopamine analysis: two-way ANOVA for repeated measures in KO NOX2 saline versus KO NOX2 amphetamine: Ftr(1,66) = 179.126, p < 0.001; Ft(11,66) = 62.712, p < 0.001; Ftr×t(11,66) = 63.847, p < 0.001; in WT amphetamine versus KO NOX2 amphetamine: Fgen(1,66) = 0.282, p = 0.615; Ft(11,66) = 62.241, p < 0.001; Ft×gen(11,66) = 0.413, p = 0.945; however, Tukey's post hoc test did not reveal any difference for time; in WT amphetamine versus KO NOX2 saline: Ftr(1,66) = 28.066, p = 0.002; Ft(11,66) = 18.176, p < 0.001; Ft×tr(11,66) = 18.651, p < 0.001; in WT saline versus KO NOX2 amphetamine: Ftr(1,66) = 198.908, p < 0.001; Ft(11,66) = 52.993, p < 0.001; Ftr×t(11,66) = 63.514, p < 0.001; in WT saline versus KO NOX2 saline: Fgen(1,66) = 0.239, p = 0.642; Ft(11,66) = 1.854, p = 0.062; Fgen×t(11,66) = 0.753, p = 0.684; in WT amphetamine versus WT saline: Ftr(1,66) = 30.049, p = 0.002; Ft(11,66) = 16.115, p < 0.001; Ftr×t(11,66) = 19.754, p < 0.001. For glutamate analysis: two-way ANOVA for repeated measures in KO NOX2 saline versus KO NOX2 amphetamine: Ftr(1,55) = 421.188, p ≤ 0.001; Ft(11,55) = 14.986, p ≤ 0.001; Ftr×t(11,55) = 14.751, p ≤ 0.001; in WT amphetamine versus KO NOX2 amphetamine: Fgen(1,55) = 0.490, p = 0.515; Ft(11,55) = 20.271, p < 0.001; Ft×gen(11,55) = 0.246, p < 0.993; however, Tukey's post hoc test did not reveal any difference for time; in WT amphetamine versus KO NOX2 saline: Ftr(1,66) = 42.943, p < 0.001; Ft(11,66) = 7.117, p < 0.001; Ft×tr(11,66) = 7.061, p < 0.001; in WT saline versus KO NOX2 amphetamine: Ftr(1,55) = 108.426, p < 0.001; Ft(11,55) = 9.661, p ≤ 0.001; Ftr×t(11,55) = 10.743, p ≤ 0.001; in WT saline versus KO NOX2 saline: Fgen(1,66) = 0.0686, p = 0.802; Ft(11,66) = 0.143, p = 0.999; Fgen×t(11,66) = 0.362, p = 0.966; in WT amphetamine versus WT saline: Ftr(1,66) = 35.877, p < 0.001; Ft(11,66) = 6.078, p < 0.001; Ftr×t(11,66) = 6.594, p < 0.001.
Figure 5.
Figure 5.
Behavioral alterations are similar in wild-type and NOX2-deficient mice after amphetamine exposure. Thirty minutes after injection with amphetamine (1 mg/kg, i.p.) or saline, mice were placed in the arena for open-field test. A–D, Bar graphs represent the frequency of groomings (A), rearings (B), crossings (C), and sniffings (D) recorded during the 20 min of the test in WT and KO NOX2 mice. For groomings: Ftr×gen(1,11) = 2.299, p = 0.147; Ftr(1,11) = 415.537, p < 0.001; Fgen(1,11) = 1.123, p = 0.312. ***p < 0.001 WT saline versus WT amphetamine and KO NOX2 saline versus KO NOX2 amphetamine; NS: WT saline versus KO NOX2 saline, p = 0.837; WT amphetamine versus KO NOX2 amphetamine, p = 1.000. For rearings: Ftr×gen(1,11) = 0.363, p = 0.703; Ftr(1,11) = 21.464, p < 0.001; Fgen(1,11) = 0.0546, p = 0.819; **p < 0.01 WT saline versus WT amphetamine; *p < 0.05 KO NOX2 saline versus KO NOX2 amphetamine; NS: WT saline versus KO NOX2 saline, p = 0.485; WT amphetamine versus KO NOX2 amphetamine, p = 0.862. For crossings: Ftr×gen(1,11) = 0.00361, p = 0.996; Ftr(1,11) = 13.164, p = 0.001; Fgen(1,11) = 0.114, p < 0.741; **p < 0.01 WT saline versus WT amphetamine; *p < 0.05 KO NOX2 saline versus KO NOX2 amphetamine; NS: WT saline versus KO NOX2 saline, p = 0.796; WT amphetamine versus KO NOX2 amphetamine, p = 0.854. For sniffings: Ftr×gen(1,11) = 1.028, p = 0.327; Ftr(1,11) = 20.887, p < 0.001; Fgen(1,11) = 0.785, p = 0.390 NS: WT saline versus KO NOX2 saline, p = 0.927; KO NOX2 saline versus KO NOX2 ketamine, p = 0.211. ***p < 0.001; **p < 0.01; *p < 0.05 using two-way ANOVA followed by Tukey's post hoc test (n = 5 WT saline; n = 5 WT amphetamine; n = 4 KO NOX2 saline; n = 5 KO NOX2 amphetamine).
Figure 6.
Figure 6.
Expression of the NMDAR-2A and NMDAR-2B in wild-type and NOX2-deficient mice after repeated ketamine injections. Mice were treated with ketamine two times within an interval of 24 h and killed 18 h after the last injection. A–D, Representative images of immunohistochemistry for NMDAR-2A protein in the prefrontal cortex. NMDAR-2A staining in wild-type (A, B) and NOX2-deficient (C, D) mice treated with saline (A, C) or ketamine (B, D). n = 4 per group. E–H, Representative images of immunohistochemistry for NMDAR-2A protein in the posterior cingulate cortex. NMDAR-2A staining in wild-type (E, F) and NOX2-deficient (G, H) mice treated with saline (E, G) or ketamine (F, H). n = 4 per group. I–L, Representative images of immunohistochemistry for NMDAR-2B protein in the prefrontal cortex. NMDAR-2B staining in wild-type (I, J) and NOX2-deficient (K, L) mice treated with saline (I, K) or ketamine (J, L). n = 4 per group. M–P, Representative images of immunohistochemistry for NMDAR-2B protein in the posterior cingulate cortex. NMDAR-2B staining in wild-type (M, N) and NOX2-deficient (O, P) mice treated with saline (M, O) or ketamine (N, P). n = 4 per group. NMDAR-2A/DAPI, NMDAR-2B/DAPI, merged images for NMDAR-2A or NMDAR-2B immunoreactivity and DAPI staining. Scale bar, 40 μm.

Similar articles

Cited by

References

    1. Avshalumov MV, Chen BT, Marshall SP, Peña DM, Rice ME. Glutamate-dependent inhibition of dopamine release in striatum is mediated by a new diffusible messenger, H2O2. J Neurosci. 2003;23:2744–2750. - PMC - PubMed
    1. Bao L, Avshalumov MV, Patel JC, Lee CR, Miller EW, Chang CJ, Rice ME. Mitochondria are the source of hydrogen peroxide for dynamic brain-cell signaling. J Neurosci. 2009;29:9002–9010. - PMC - PubMed
    1. Bassareo V, Di Chiara G. Differential influence of associative and nonassociative learning mechanisms on the responsiveness of prefrontal and accumbal dopamine transmission to food stimuli in rats fed ad libitum. J Neurosci. 1997;17:851–861. - PMC - PubMed
    1. Bedard K, Krause KH. The NOX family of ROS-generating NADPH oxidases: physiology and pathophysiology. Physiol Rev. 2007;87:245–313. - PubMed
    1. Behrens MM, Ali SS, Dao DN, Lucero J, Shekhtman G, Quick KL, Dugan LL. Ketamine-induced loss of phenotype of fast-spiking interneurons is mediated by NADPH-oxidase. Science. 2007;318:1645–1647. - PubMed

Publication types

MeSH terms

LinkOut - more resources