Comparative Study
. 2010 Aug 25;30(34):11369-78.
doi: 10.1523/JNEUROSCI.0529-10.2010.

Defects in mitochondrial axonal transport and membrane potential without increased reactive oxygen species production in a Drosophila model of Friedreich ataxia

Affiliations
Comparative Study

Defects in mitochondrial axonal transport and membrane potential without increased reactive oxygen species production in a Drosophila model of Friedreich ataxia

Yujiro Shidara et al. J Neurosci. .

Abstract

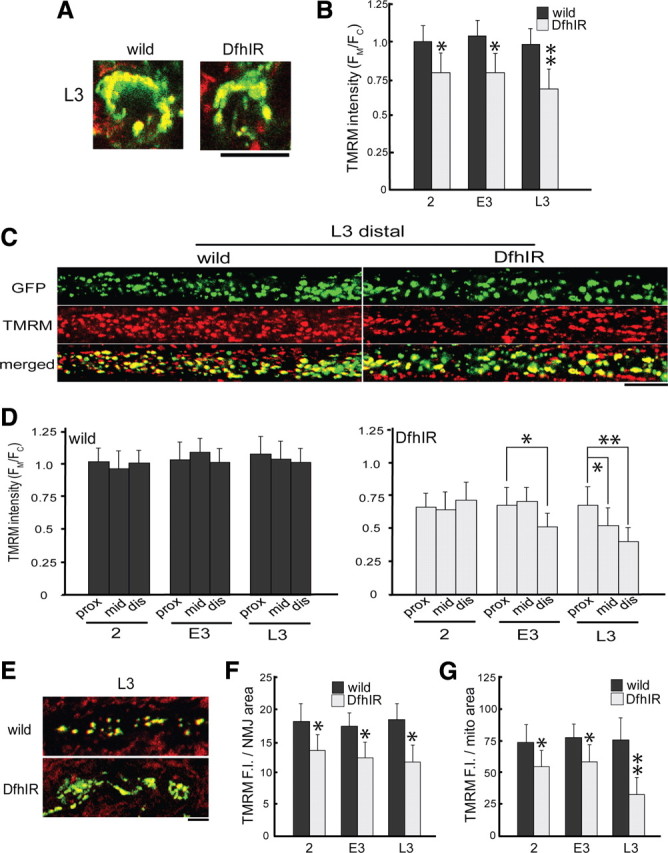
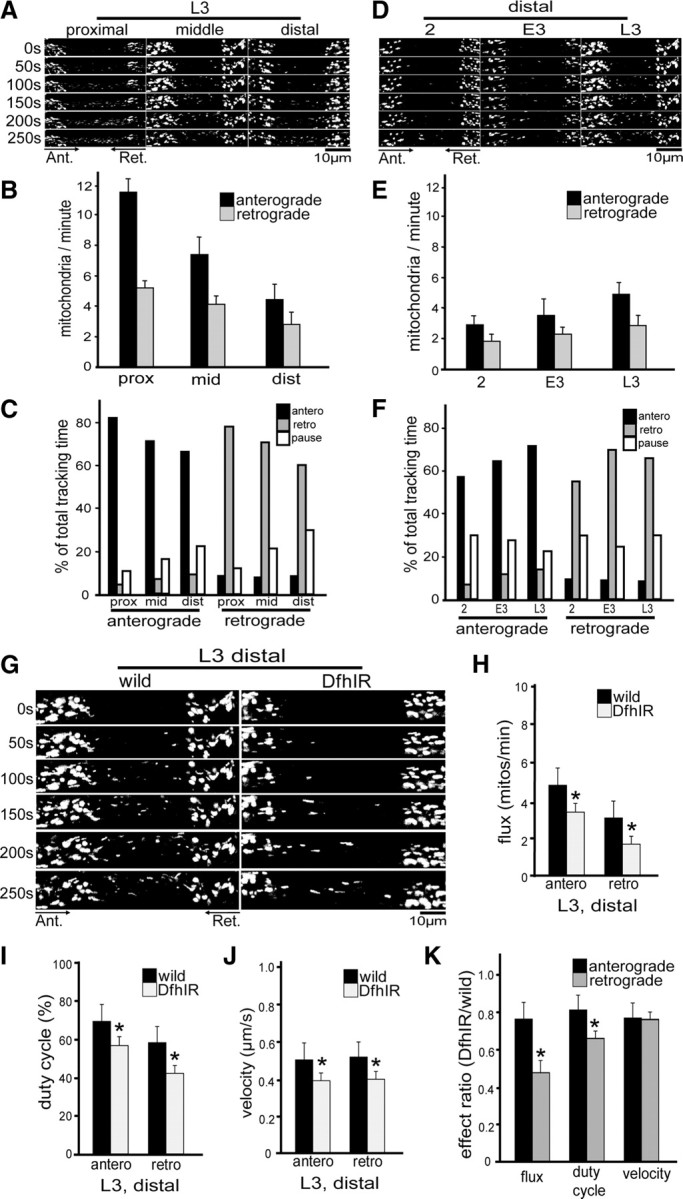
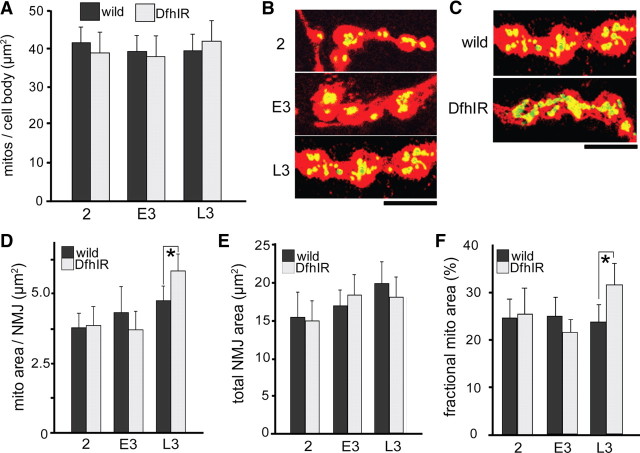
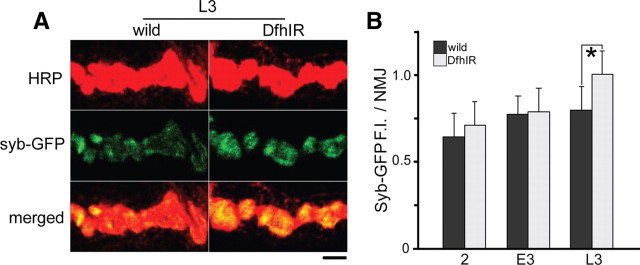
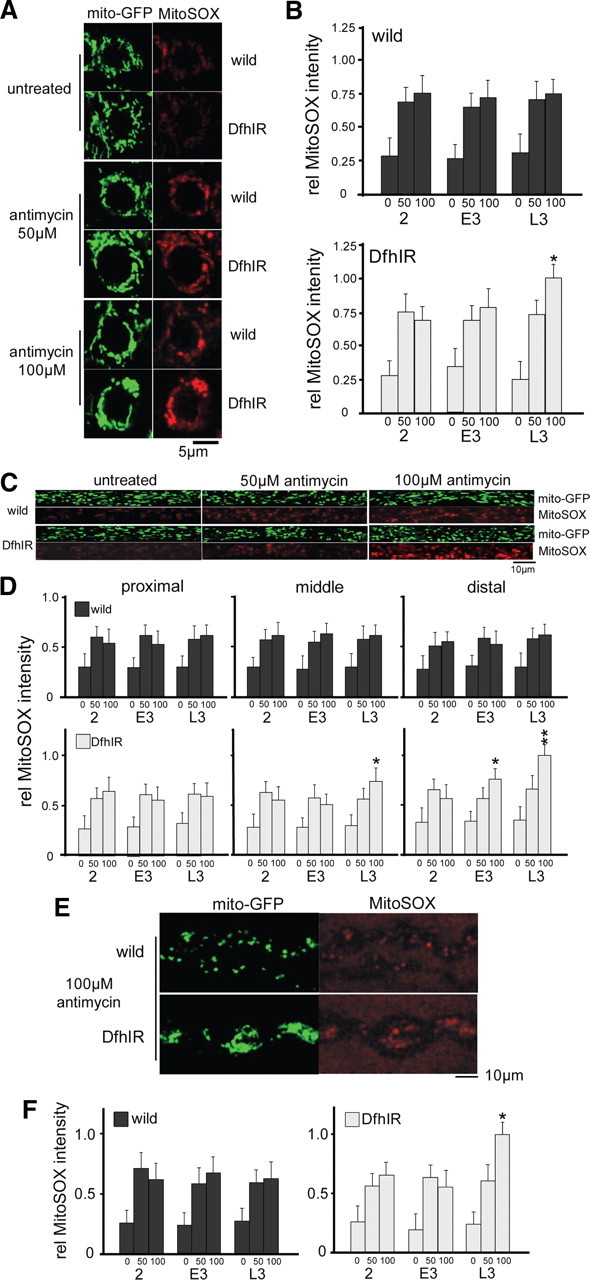
Friedreich ataxia, a neurodegenerative disorder resulting from frataxin deficiency, is thought to involve progressive cellular damage from oxidative stress. In Drosophila larvae with reduced frataxin expression (DfhIR), we evaluated possible mechanisms of cellular neuropathology by quantifying mitochondrial axonal transport, membrane potential (MMP), and reactive oxygen species (ROS) production in the DfhIR versus wild-type nervous system throughout development. Although dying-back neuropathy in DfhIR larvae did not occur until late third instar, reduced MMP was already apparent at second instar in the cell bodies, axons and neuromuscular junctions (NMJs) of segmental nerves. Defects in axonal transport of mitochondria appeared late in development in distal nerve of DfhIR larvae, with retrograde movement preferentially affected. As a result, by late third instar the neuromuscular junctions (NMJs) of DfhIR larvae accumulated a higher density of mitochondria, many of which were depolarized. Notably, increased ROS production was not detected in any neuronal region or developmental stage in DfhIR larvae. However, when challenged with antimycin A, neurons did respond with a larger increase in ROS. We propose that pathology in the frataxin-deficient nervous system involves decreased MMP and ATP production followed by failures of mitochondrial transport and NMJ function.


Figures

Figure 1.
Figure 1.
Axonal degeneration from the distal end and neuronal cell death in the ventral ganglion are apparent at third instar in DfhIR larvae. A, Anti-frataxin immunoblots were performed with extracts of whole larvae, at second, early third and late third instar (2, E3 and L3, respectively) quantified, and normalized for GFP content using anti-GFP. DfhIR crossed into the mito-GFP background resulted in a 30–40% reduction in whole-larval frataxin expression relative to wild type at the same stage. Bodian- and H&E-stained paraffin sections of larvae were used to quantitate changes during development: B shows wild-type and DfhIR segmental nerve cross sections at L3 in the distal axon; D shows wild-type and DfhIR ventral ganglia at L3. C, Quantitive morphometry showed that in wild-type larvae, the cross sectional area of the segmental nerve did not change during development, or along the proximodistal axis at any point during development. In DfhIR larvae, the cross sectional area was significantly decreased in the distal region of the nerve (at segments A6 and A8) at L3. E, F, Morphometry of cell bodies in the ventral ganglion showed that in DfhIR larvae, both the area of the cortical region of the ganglion (E) and the number of cell bodies (F) were significantly decreased at L3 in DfhIR relative to wild type. All error bars represent the SD, and significant differences between DfhIR and wild-type values for specific stages or regions are indicated (*p < 0.05, n = 40 for all experiments).
Figure 2.
Figure 2.
Mitochondrial transmembrane potential is diminished throughout the neurons of DfhIR larvae compared with wild-type. A, B, In individual cell bodies in the ventral ganglion, mito-GFP fluorescence was used to identify mitochondria (A, green) and TMRM fluorescence was used to measure membrane potential (red, overlap is yellow in merged image). Note that the TMRM signal includes mitochondria in sensory axons that do not express mito-GFP and were not included in any measurements. B, The ratio of mitochondrial to cytoplasmic TMRM fluorescence values (FM/FC) was determined at second, early third, and late third instar (2, E3, L3, respectively), divided by the wild-type second instar mean value to normalize and plotted, showing that DfhIR cell bodies had diminished MMP throughout development relative to wild-type mito-GFP cell bodies. C, D, In segmental nerve axons, mitochondria were observed throughout development in all three regions—here, images of mitochondrial GFP fluorescence and TMRM in the distal axon at L3 show the diminished MMP in DfhIR axons. D, The mitochondrial FM/FC was determined in segmental nerves at each stage and axonal region and divided by the wild-type proximal second instar value to normalize. Plots of these values show that in wild-type larvae MMP did not vary with age or distance from the ventral ganglion (D, left); however, DfhIR larvae not only showed diminished MMP at all stages and axonal positions, but also showed an increasing effect with age and distance from the ventral ganglion (D, right). E–G, In neuromuscular junctions, mitochondrial TMRM fluorescence intensity per area of the NMJ had already declined relative to controls by second instar, and dropped to <70% of control levels by late third instar (F); the TMRM fluorescence per mitochondrial area declined to less than half wild type (G). Merged images of TMRM (red) and mito-GFP fluorescence at right show that at late third instar, many mitochondria in DfhIR NMJs show complete depolarization (E). Scale bars: A, C, E, 10 μm. *p < 0.05, **p < 0.01; error bars denote SD; n = 30 for all TMRM measurements.
Figure 3.
Figure 3.
In segmental nerve axons of DfhIR larvae, mitochondrial flux, transport duty cycle and velocity are diminished compared with wild type at late third instar. Mitochondrial movements were tracked in segmental nerves of second, early third and late third instar larvae, in the proximal, middle and distal region of the nerves. All images are oriented with the cell bodies (ventral ganglion) to the left, so that anterograde transport is from left to right. A shows images of mitochondria in a wild-type late third instar larva moving into a bleached region in both directions in all three regions of the nerve. B, C, Both the flux of mitochondria (B) and their duty cycle (C) decline from the proximal to distal axons. D shows mitochondria moving into a bleached region of the distal nerve of normal larvae in both directions, at three stages of development. E, F, In axons of the distal nerve, both the flux of mitochondria (E) and their duty cycle (F) increase during development from second to late third instar. G compares mitochondrial movements between wild-type and DfhIR larvae at late third instar in the distal region. H–K, In DfhIR larvae, mitochondrial flux (H), duty cycle (I) and velocity (J) are significantly reduced in both directions, but retrograde flux and duty cycle are more strongly affected than anterograde (K). Scale bars, 10 μm. *p < 0.05, n ≥ 30 for each experiment; error bars represent the SD.
Figure 4.
Figure 4.
DfhIR larvae show an abnormal accumulation of mitochondria in the NMJs by late third instar. A, The density of mitochondria in motor cell bodies of the ventral ganglion, determined as the ratio of mito-GFP area to neuronal cell body area, remains nearly constant during development and is the same in wild-type and DfhIR larvae. B, A merged image of HRP immunostaining (red) and mito-GFP (green, yellow in overlap with HRP) shows wild-type NMJs of second, early third, and late third instar larvae. C, A merged image of mito-GFP and HRP immunostaining shows that in late third instar larvae, NMJs of DfhIR larvae have a higher mitochondrial density than those of wild type. D–F, Quantitation of the area of mito-GFP signal per NMJ (D), total NMJ area (E), and the fraction of the NMJ occupied by mitochondria (F) for wild-type and DfhIR larval NMJs from second through late third instar shows the increases in both mitochondrial and total NMJ area with development, and confirms the excessive mitochondrial density of late third instar DfhIR NMJs. Scale bar, 5 μm. *p < 0.05, n = 40 for all experiments; error bars represent the SD.
Figure 5.
Figure 5.
DfhIR larvae accumulate excess synaptobrevin-containing vesicles in their synaptic NMJs at third instar compared with controls. A, Synaptic (synaptobrevin-containing) vesicles in motor neurons were visualized by D42-syb-GFP (green) and NMJs were counterstained with anti-HRP antibody (red, overlap with green shown as yellow); late third instar is shown here. B, Synaptic vesicle densities were determined as the ratio of the number of syb-GFP pixels to the number of HRP pixels at second, early third and late third instar. Late third instar DfhIR larvae show increased density of synaptic vesicles in their NMJs relative to wild type. All error bars represent the SD and significant differences between DfhIR and wild-type NMJs are indicated (*p < 0.05, n = 40 for all experiments). Scale bar, 2.5 μm.
Figure 6.
Figure 6.
DfhIR neurons do not produce intrinsically higher levels of ROS, but are more susceptible to treatment with the complex III inhibitor antimycin. A–F, Fluorescence intensities of mitoGFP (green) and MitoSOX (red) were used to determine relative levels of ROS production in cell bodies in the ventral ganglion (A, B), axons (C, D), and NMJs (E, F) of DfhIR and wild-type neurons, with and without antimycin treatment, and throughout larval development. Neither wild-type nor DfhIR cell bodies showed increased ROS during development, and DfhIR cell bodies (B, top histogram) did not show higher ROS levels than wild type (B, bottom histogram). Both 50 and 100 μm antimycin treatments elicited higher ROS levels in wild-type and DfhIR cell bodies at all developmental stages, but at late third instar, DfhIR cell bodies responded to antimycin with higher ROS levels than did wild type (B). In axons (C), there were also no significant differences between DfhIR and wild-type ROS levels in any region of the nerve or time in development, but DfhIR axons showed higher ROS levels in response to antimycin in the middle region of the axons at late third instar, and in the distal region at early and late third instar (D). There was also no difference between ROS levels in DfhIR and wild-type NMJs through development, but DfhIR NMJs at late third instar responded to antimycin with higher ROS levels than wild type (E, F). For quantification, all error bars represent the SD and significant differences between DfhIR and wild-type values are indicated (*p < 0.05, **p < 0.01, n = 40 for all experiments).

Similar articles

Cited by

References

    1. Alexander C, Votruba M, Pesch UE, Thiselton DL, Mayer S, Moore A, Rodriguez M, Kellner U, Leo-Kottler B, Auburger G, Bhattacharya SS, Wissinger B. OPA1, encoding a dynamin-related GTPase, is mutated in autosomal dominant optic atrophy linked to chromosome 3q28. Nat Genet. 2000;26:211–215. - PubMed
    1. Anderson PR, Kirby K, Hilliker AJ, Phillips JP. RNAi-mediated suppression of the mitochondrial iron chaperone, frataxin, in Drosophila. Hum Mol Genet. 2005;14:3397–3405. - PubMed
    1. Anderson PR, Kirby K, Orr WC, Hilliker AJ, Phillips JP. Hydrogen peroxide scavenging rescues frataxin deficiency in a Drosophila model of Friedreich's ataxia. Proc Natl Acad Sci U S A. 2008;105:611–616. - PMC - PubMed
    1. Balaban RS, Nemoto S, Finkel T. Mitochondria, oxidants, and aging. Cell. 2005;120:483–495. - PubMed
    1. Baloh RH, Schmidt RE, Pestronk A, Milbrandt J. Altered axonal mitochondrial transport in the pathogenesis of Charcot-Marie-Tooth disease from mitofusin 2 mutations. J Neurosci. 2007;27:422–430. - PMC - PubMed

Publication types

MeSH terms

Substances