Comparative Study
. 2010 Aug 25;30(34):11414-25.
doi: 10.1523/JNEUROSCI.2127-10.2010.

Microglial receptor for advanced glycation end product-dependent signal pathway drives beta-amyloid-induced synaptic depression and long-term depression impairment in entorhinal cortex

Affiliations
Comparative Study

Microglial receptor for advanced glycation end product-dependent signal pathway drives beta-amyloid-induced synaptic depression and long-term depression impairment in entorhinal cortex

Nicola Origlia et al. J Neurosci. .

Abstract

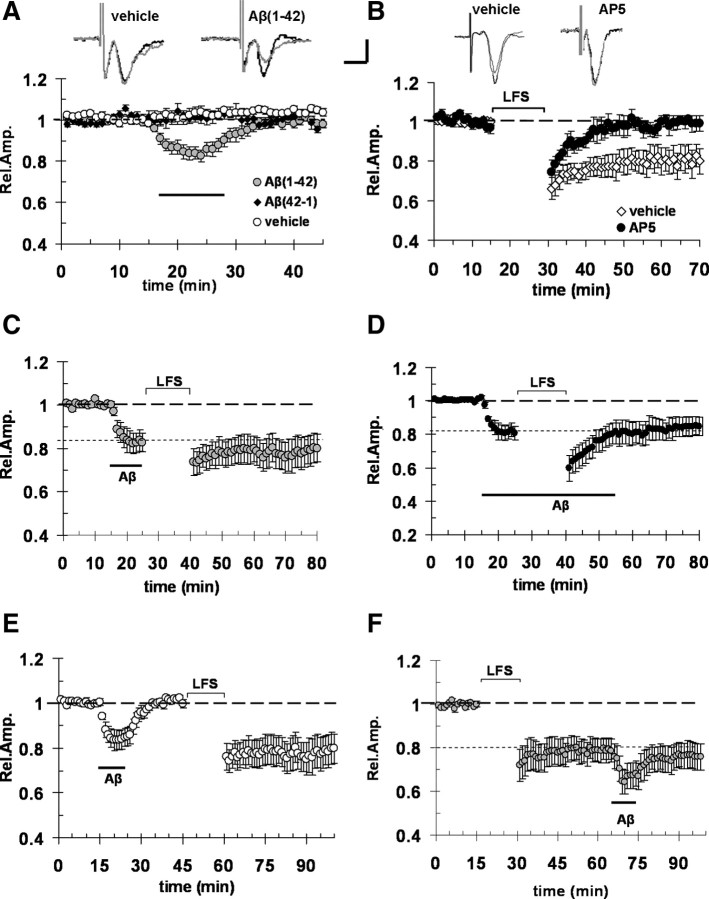
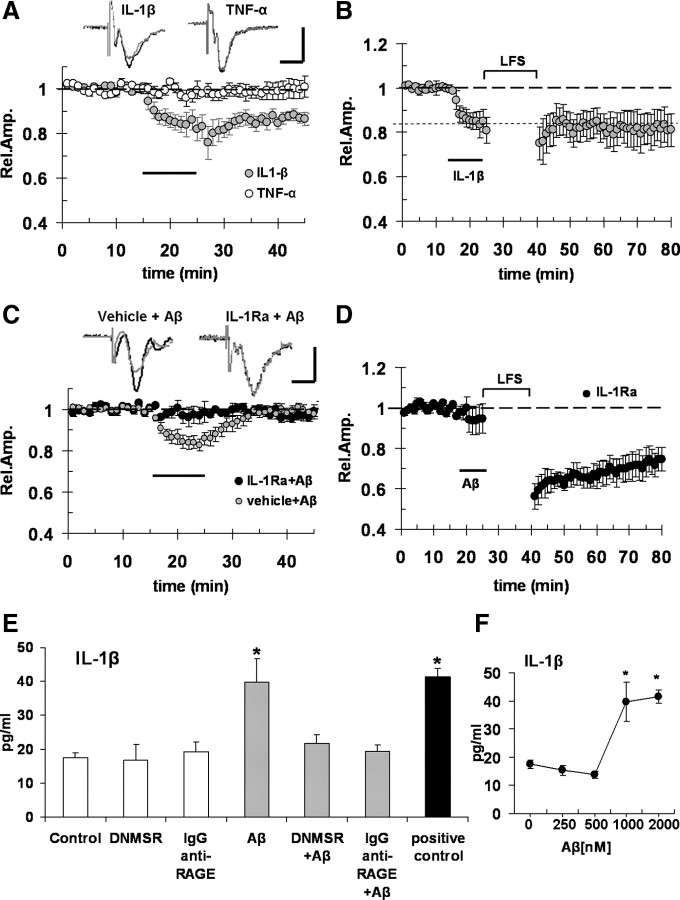
Overproduction of beta-amyloid (Abeta) is a pathologic feature of Alzheimer's disease, leading to cognitive impairment. Here, we investigated the impact of cell-specific receptor for advanced glycation end products (RAGE) on Abeta-induced entorhinal cortex (EC) synaptic dysfunction. We found both a transient depression of basal synaptic transmission and inhibition of long-term depression (LTD) after the application of Abeta in EC slices. Synaptic depression and LTD impairment induced by Abeta were rescued by functional suppression of RAGE. Remarkably, the rescue was only observed in slices from mice expressing a defective form of RAGE targeted to microglia, but not in slices from mice expressing defective RAGE targeted to neurons. Moreover, we found that the inflammatory cytokine IL-1beta (interleukin-1beta) and stress-activated kinases [p38 MAPK (p38 mitogen-activated protein kinase) and JNK (c-Jun N-terminal kinase)] were significantly altered and involved in RAGE signaling pathways depending on RAGE expression in neuron or microglia. These findings suggest a prominent role of microglial RAGE signaling in Abeta-induced EC synaptic dysfunction.


Figures

Figure 1.
Figure 1.
Aβ (1 μm) causes synaptic depression and LTD impairment in entorhinal cortex. A, Acute application of 1 μm Aβ(1-42) for 10 min (corresponding to dark bar) induced a depression of FP amplitude (gray circles), whereas no change in FP amplitude was observed in vehicle-treated slices (white circle) and in control slices treated with the reverse sequence peptide Aβ(42-1) at 1 μm for 10 min (black circles); the insets represent typical traces of FPs recordings before (thick line) and during Aβ perfusion. B, LFS (900 paired pulses at 1 Hz, 30 ms interstimulus interval) was able to induce LTD in control vehicle-treated slices, but failed to do so in slices treated with 50 μm AP5; the insets represent typical traces of FPs recordings before and after LFS in vehicle- or AP5-treated slices. C, Bath perfusion with 1 μm Aβ before LFS stimulation induced a significant depression of FP amplitude that inhibits LFS-induced LTD; indeed, the magnitude of FPs after LFS was unchanged. D, LTD was blocked by prolonged perfusion (40 min) with Aβ (1 μm) and simultaneous LFS application. E, Acute application for 10 min (dark bar) of Aβ (1 μm) induced a depression of FP amplitude that recovers to the baseline after washout; LTD was normally expressed when LFS was applied after Aβ washout. F, Aβ (10 min perfusion)-induced depression was not occluded by LFS. Calibration: A, B, horizontal, 5 ms; vertical, 0.5 mV. Error bars indicate SEM.
Figure 2.
Figure 2.
Aβ (1 μm) affects mEPSC amplitude and depresses AMPA-mediated synaptic transmission. A, mEPSCs recorded in the presence of TTX (1 μm) and bicuculline (3 μm); examples of traces recorded before, during, and after perfusion with 1 μm Aβ(1-42). Calibration: horizontal, 10 s; vertical, 20 pA. B, The plot represents average mEPSC amplitude recorded in control condition (vehicle), during 10 min perfusion with 1 μm Aβ, and after Aβ washout. mEPSC amplitude was significantly decreased (*p < 0.05) during Aβ perfusion; after washing out Aβ, the amplitude of mEPSCs returned to control values. C, Ten minute perfusion with 1 μm Aβ had no effect on the frequency of mEPSC; plot represents average frequency of mEPSCs recorded in control condition (vehicle), during 1 μm Aβ perfusion, and after Aβ washout. D, Traces represent examples of evoked EPSCs that were recorded at −70 and +50 mV, respectively, in control (vehicle) and after 1 μm Aβ perfusion. The amplitude of AMPA EPSC component was measured at −70 mV, whereas NMDA EPSC component was calculated at +50 mV, 50 ms after the AMPA peak (see dashed lines). The gray traces represent recordings at +50 mV, where the AMPA component was isolated using AP5 (50 μm). Calibration: horizontal, 50 ms; vertical, 50 pA. E, Perfusion with 1 μm Aβ caused a significant reduction of AMPA-mediated EPSC peak amplitude; in the top panel, the plot represents averaged relative amplitude of AMPA EPSCs recorded at −70 mV in control condition (vehicle), during 10 min of 1 μm Aβ perfusion, and after Aβ washout (*p < 0.01). In the bottom panel, a complete I–V curve is reported for AMPA EPSCs recorded in control (vehicle), during Aβ perfusion. F, Aβ did not significantly affect NMDA currents; in the top panel, the plot represents averaged relative amplitude of NMDA EPSCs recorded at +50 mV in control condition (vehicle), during 10 min of 1 μm Aβ perfusion, and after Aβ washout (*p < 0.01). In the bottom panel, a complete I–V curve is reported for NMDA EPSCs recorded in control (vehicle) conditions and under Aβ perfusion. Error bars indicate SEM.
Figure 3.
Figure 3.
Microglial RAGE contributes to Aβ-induced synaptic depression and LTD impairment. A, Blockade of RAGE by either knocking out RAGE gene or with neutralizing anti-RAGE IgG was able to prevent Aβ depression; FP amplitude in RAGE-null (black circles) and anti-RAGE IgG (white circles)-treated slices did not significantly change during 10 min 1 μm Aβ(1-42) perfusion (dark bar) and was significantly different from FP amplitude in WT slices treated with Aβ alone (gray circles). B, RAGE-deficient signaling in neurons (DN-RAGE, white circles) was not sufficient to prevent 1 μm Aβ-induced synaptic depression; in contrast, Aβ failed to induce synaptic depression in DNMSR slices characterized by RAGE signaling deficiency in microglia (black squares). After 1 μm Aβ treatment (dark bar), LTD was not impaired and normally expressed in anti-RAGE IgG-treated (C, white squares), RAGE-null (D, black circles), and DNMSR slices (E, dark squares). F, In contrast, LTD impairment was observed in DN-RAGE slices treated with Aβ. The insets in A and B represent typical traces of FPs recordings before (dark line) and during (gray line) Aβ perfusion. Calibration: horizontal, 5 ms; vertical, 0.5 mV. Error bars indicate SEM.
Figure 4.
Figure 4.
Aβ-induced depression and LTD impairment is partially mimicked by IL-1β and prevented by IL-1β receptor antagonist. A, IL-1β (1 ng/ml; gray circles) treatment for 10 min (dark bar), but not TNF-α (5 ng/ml; white circles), was able to significantly depress basal synaptic transmission. B, IL-1β (1 ng/ml) perfusion for 10 min (dark bar) before LFS impaired LTD. C, D, When slices were treated with 20 ng/ml IL-1Ra, 1 μm Aβ (dark bar) failed to induce synaptic depression of FP amplitude (C, black circles) and prevented LTD impairment (D, black circles). The insets in A and C represent typical traces of FPs recordings before (dark line) and during (gray line) Aβ perfusion. Calibration: horizontal, 5 ms; vertical, 0.5 mV. E, The plot represents average IL-1β levels (in picograms per milliliter) in EC slices; IL-1β level was significantly increased in cortical slices exposed to 1 μm Aβ for 10 min, whereas deficiency of RAGE signaling in microglia (DNMSR slices) or complete RAGE inactivation by anti-RAGE IgG (2.5 μg/ml) did not modify basal IL-1β levels but prevented Aβ effect maintaining IL-1β levels comparable with control values (p < 0.05 vs control). Serum samples were used as positive control provided with the kit. F, The plot represents IL-1β levels in EC slices exposed to increasing Aβ concentrations; as reported in E, 1 μm Aβ elevated IL-1β levels, whereas lower concentrations (250 and 500 nm) of Aβ did not produce any increase in IL-1β with respect to control slices; moreover, increase of Aβ concentration up to 2 μm did not induce significantly higher IL-1β levels with respect to those measured in 1 μm-treated slices [*p < 0.05 vs vehicle-treated slices (0), 250 and 500 nm]. Error bars indicate SEM.
Figure 5.
Figure 5.
Aβ-induced depression and LTD impairment is prevented by inhibition of JNK and p38 MAPK. A, Treatment of slices with 1 μm SB203580 and 20 μm SP600125 (black diamond and white circles, respectively); application of 1 μm Aβ(1-42) for 10 min (dark bar) was unable to induce synaptic depression. B, LFS-induced LTD was completely abolished by p38 MAPK inhibition with SB203580 (1 μm; gray squares) but was normally expressed in slices after JNK inhibition with SP600125 (20 μm; gray circles). C, SP600125 treatment rescued a normal LTD in slices after 1 μm Aβ exposure (for 10 min; dark bar). Error bars indicate SEM.
Figure 6.
Figure 6.
Aβ (1 μm) increases p38 MAPK/JNK phosphorylation in cortical slices. A, The plot represents averaged phospho-p38 MAPK levels measured using ELISA and expressed as unit/total content of p38 MAPK protein. Tissue levels of phospho-p38 MAPK after slices perfusion with 1 μm Aβ(1-42) were significantly higher with respect to control vehicle-treated slices (*p < 0.05 vs control vehicle) both before and after LFS. Selective deficiency of RAGE signaling in microglia (DNMSR) and complete inactivation of RAGE with anti-RAGE IgG did not modify basal level of phospho-p38 MAPK (p > 0.05 vs control vehicle). Blockade of RAGE was able to prevent Aβ-induced increase of phospho-p38 MAPK (p < 0.05 vs slices treated with Aβ alone), even if the increase induced by LFS was still present. p38 MAPK activation by Aβ was also significantly reduced in slices treated with IL-1Ra (p < 0.05 vs Aβ alone) and in slices treated with the JNK inhibitor SP600125 (p < 0.05 vs Aβ alone). B, The plot represents averaged phospho-JNK levels measured using ELISA and expressed as unit/total content of JNK protein. Elevated phospho-JNK levels were increased by 1 μm Aβ treatment (*p < 0.05 vs control vehicle) but not by LFS. Deficiency of RAGE signaling in microglia (DNMSR) and complete inactivation of RAGE with anti-RAGE IgG did not modify basal level of phospho-JNK both before and after LFS (p > 0.05 vs control vehicle). Blockade of RAGE was able to prevent Aβ-induced increase of phospho-JNK (p < 0.05 vs slices treated with Aβ alone). Phospho-JNK level after 1 μm Aβ treatment was also significantly reduced in slices treated with IL-1Ra (p < 0.05 vs Aβ alone). C, The plot represents average IL-1β levels (in picograms per milliliter) in EC slices; IL-1β level was significantly increased in cortical slices exposed to 1 μm Aβ for 10 min, whereas inhibition of JNK (SP600125) but not of p38 MAPK (SB203580) prevented Aβ effect and IL-1β levels were comparable with control values (p > 0.05 vs control). Error bars indicate SEM.

References

    1. Akiyama H, Barger S, Barnum S, Bradt B, Bauer J, Cole GM, Cooper NR, Eikelenboom P, Emmerling M, Fiebich BL, Finch CE, Frautschy S, Griffin WS, Hampel H, Hull M, Landreth G, Lue L, Mrak R, Mackenzie IR, McGeer PL, et al. Inflammation and Alzheimer's disease. Neurobiol Aging. 2000;21:383–421. - PMC - PubMed
    1. Anderson WW, Collingridge GL. The LTP program: a data acquisition program for on-line analysis of long-term potentiation and other synaptic events. J Neurosci Methods. 2001;108:71–83. - PubMed
    1. Arancio O, Zhang HP, Chen X, Lin C, Trinchese F, Puzzo D, Liu S, Hegde A, Yan SF, Stern A, Luddy JS, Lue LF, Walker DG, Roher A, Buttini M, Mucke L, Li W, Schmidt AM, Kindy M, Hyslop PA, et al. RAGE potentiates Abeta-induced perturbation of neuronal function in transgenic mice. EMBO J. 2004;23:4096–4105. - PMC - PubMed
    1. Bennett BL, Sasaki DT, Murray BW, O'Leary EC, Sakata ST, Xu W, Leisten JC, Motiwala A, Pierce S, Satoh Y, Bhagwat SS, Manning AM, Anderson DW. SP600125, an anthrapyrazolone inhibitor of Jun N-terminal kinase. Proc Natl Acad Sci U S A. 2001;98:13681–13686. - PMC - PubMed
    1. Bianchi R, Giambanco I, Donato R. S100B/RAGE-dependent activation of microglia via NF-kappaB and AP-1 Co-regulation of COX-2 expression by S100B, IL-1beta and TNF-alpha. Neurobiol Aging. 2010;31:665–677. - PubMed

Publication types

MeSH terms

Substances