Comparative Study
. 2010 Aug 25;30(34):11476-85.
doi: 10.1523/JNEUROSCI.5252-09.2010.

Transcranial electric stimulation entrains cortical neuronal populations in rats

Affiliations
Comparative Study

Transcranial electric stimulation entrains cortical neuronal populations in rats

Simal Ozen et al. J Neurosci. .

Abstract

Low intensity electric fields have been suggested to affect the ongoing neuronal activity in vitro and in human studies. However, the physiological mechanism of how weak electrical fields affect and interact with intact brain activity is not well understood. We performed in vivo extracellular and intracellular recordings from the neocortex and hippocampus of anesthetized rats and extracellular recordings in behaving rats. Electric fields were generated by sinusoid patterns at slow frequency (0.8, 1.25 or 1.7 Hz) via electrodes placed on the surface of the skull or the dura. Transcranial electric stimulation (TES) reliably entrained neurons in widespread cortical areas, including the hippocampus. The percentage of TES phase-locked neurons increased with stimulus intensity and depended on the behavioral state of the animal. TES-induced voltage gradient, as low as 1 mV/mm at the recording sites, was sufficient to phase-bias neuronal spiking. Intracellular recordings showed that both spiking and subthreshold activity were under the combined influence of TES forced fields and network activity. We suggest that TES in chronic preparations may be used for experimental and therapeutic control of brain activity.


Figures
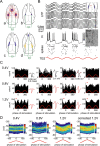
Figure 1.
Figure 1.
Entrainment of subthreshold and suprathreshold neuronal activity by TES. A, Schematic of 4 electrode configurations used for electric field stimulation. Aa, Wire coils placed on the skull for chronic stimulation. Red dashed lines, idealized electric fields around the electrodes. The coils on the left and right sides of the skull had the same virtual polarity against the third electrode placed above the frontal cortex. Ab, Screws driven halfway through the skull. Ac, Wires placed on the skull. Ad, Flexible cables placed epidurally and a silver wire placed in the oral cavity of the animal. B, Multiple-site recording of unit and LFP with a 4-shank silicon probe from the prefrontal cortex (activity from 3 shanks is shown; faulty sites are excluded) and simultaneous intracellular recording from a layer V pyramidal cell in the somatosensory area in an anesthetized rat. Top inset, Locations of the stimulation electrodes, intracellular electrode, green, and the silicon probe, red. Bottom inset, Photograph of the biocytin-labeled neuron. Dots, spikes of extracellularly recorded putative single neurons. Red sinusoid line, applied field. Bipolar stimulation (Ac) at 1.25 Hz, 0.4 V intensity. C, TES phase-locked discharge of 3 example units and 1 intracellularly recorded unit (last column) at 3 different stimulation intensities. Averages of >300 stimulation cycles. Average filtered unit waveforms, recorded from the probe site with the largest amplitude unit, are shown for different intensity TES epochs (red). Waveforms during prestimulation epochs (black) are shown in the top row, superimposed on the waveforms recorded during 0.4 V TES. Same time scale applies for all waveforms; amplitude scale is shown for each unit at the top row. Unit on the right is the intracellularly recorded neuron. Red stars indicate significantly phase-modulated units (p < 0.01, Kuiper's test). D, Illustration of intrinsic network- and extrinsic field-control of neural activity. Joint probability density counts of Vi of the layer V neuron shown in B and the phase of the TES signal are shown for different intensities of stimulation; weak 0.4 V, moderate 0.8 V and strong 1.2 V applied fields. Stimulation phase is illustrated by the red line. Warmer colors indicate high probability of occurrence. Rightmost panel (corrected 1.2 V), Vi corrected by subtracting the signal, extracellularly recorded after withdrawing the pipette from the neuron. Note the coexistence of network-induced Vi bimodality (hot color bands at two Vi levels) and increasing phase-locking of Vi to the applied field as its strength increases (note the increasing differences between 0° and 180° of TES of DOWN state probabilities).
Figure 2.
Figure 2.
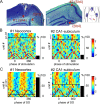
TES entrains neurons in multiple cortical areas. A, Histologically verified tracks of a 4-shank silicon probe. Tracks of the two most lateral probe shanks are shown in the neocortex (left, Sh4 and Sh3) and the deep recording sites in the hippocampus (right, sh4). The silicon probe was moved deeper after each recording session. Probe recordings were made at 2 different recording depths (arrows): in the deep layers of the neocortex (1) and hippocampal CA1-subiculum area (2). Right inset, Locations of the stimulation electrodes, silicon probe (red) and tetrodes (purple). B, TES entrainment of neurons in 2 recording sessions from the same rat. Each row corresponds to a single-unit or a multiunit cluster, color-coded for standardized firing rate (mean subtracted from instantaneous rate and divided by the SD). Units are sorted for each electrode separately by their p-values (increasing from top to bottom) to illustrate the effectiveness of TES-induced unit entrainment. Black lines separate the significantly modulated units (p < 0.01, above) from the nonmodulated ones below. Side bars, percentage of neurons significantly modulated by TES (p < 0.01; Kuiper's test). Note that TES entrainment of both neocortical and hippocampal neurons occur at the same phase. TES, 1.25 Hz, 3-pole configuration (Fig. 1Aa) across multiple repetitions of at least 7 min epochs. The fraction of TES-entrained neurons is overestimated because neurons firing at a low rate are not detected properly by clustering algorithms. Left to right, 4.2 V, 4.8 V intensity, respectively, Colors are z-scored (scale on the right). C, Network-controlled phase-locking of neuronal activity to slow oscillations during natural sleep (illustrated by black line) in the absence of TES. SO, slow oscillation. Unit identity is the same as in B. Note strong phase-locking of deep layer neocortical neurons to slow oscillation (Steriade et al., 1993), moderate entrainment of CA1-subicular cells (Isomura et al., 2006). Reference LFP site in each experiment was the deep layer of the contralateral neocortex.
Figure 3.
Figure 3.
Entrainment of cortical unit activity by TES. A, Example filtered (1–5 kHz) extra-cellular trace during TES (1.25 Hz, 4.8 V intensity). B, Averaged TES phase onset and offset-triggered histogram of an example unit (1.25 Hz, 4.8 V intensity, 3-pole configuration as in Fig. 1Aa). Note the lack of persistence of rhythmic entrainment after TES offset (right histogram). Red dotted lines, Troughs of the first and the last cycles. Insets, Average filtered unit waveform recorded during prestimulation epochs (black) and during TES (red). C, Stability of unit entrainment by TES. Five example cortical units recorded simultaneously. Each dot represents a spike, as a function of stimulus phase (ordinate) during 10 successive (1.25 Hz, 2.8 V intensity, 3-pole configuration), 1-min-long stimulation trials (red bars) with 1-min-long resting (stimulation-free) intervals in between. Spikes for 20 s of presham and postsham periods are shown. Spikes during the remaining stimulation-free periods are not shown to aid the clarity of the display. Note stability of TES entrainment over multiple stimulations. Left, TES phase histograms for the entire session. Insets (right), Average filtered unit waveforms recorded during prestimulation epochs (black) and during TES (red, superimposed).
Figure 4.
Figure 4.
TES intensity-dependent phase-modulation of cortical unit activity. A, Illustration of TES intensity dependence of unit entrainment. Each row represents color-coded, normalized discharge probability of single-unit or multiunit firing as a function of the phase of TES at 3 different intensities (0.4 V, 1.6 V, 2.8 V) in animal a1. Units are ordered by the significance of their phase entrainment (p-value, Kuiper's test); the unit with the smallest p-value is at the top. Black lines separate the significantly modulated units (p < 0.01) from the nonmodulated ones. B, Percentage of significantly modulated neurons in 3 chronically implanted rats (a1, a2, a3) as a function of stimulation intensity. Each column represents a single recording session (1.25 Hz, 3-pole configuration, as in Fig. 1Aa). The lowest intensity tested was 0.2 V. Intensities lower than 3 V were not tested in animal a3. The fraction of TES-entrained neurons is overestimated because neurons firing at a low rate are not detected properly by clustering algorithms.
Figure 5.
Figure 5.
Determination of the magnitude of the TES-induced field. A, Locations of the penetration sites for measuring the volume-conducted local potentials (0.8 Hz; 3-pole configuration as in Fig. 1Ad). Star indicates the anatomical location of unit recording. B, Locally measured voltage between each active recording site, indicated by the color code in A, and the reference electrode, R. G, ground. Depth measurements were performed with a 32-site single-shank probe, with recording sites spaced at 50 μm intervals along the vertical axis of the probe. TES, 0.8 Hz, 0.12 mA intensity. C, Short epoch of simultaneously recorded LFP from deep layers of the neocortex and the underlying hippocampus; orange site in A. Recording sites ch26 and ch27 correspond to layer V, while ch6 recorded from the CA1 pyramidal layer. Note ripple-related reversal of sharp wave in the CA1 str. radiatum. D, Example unit histograms during TES stimulation. Red star indicates the significant modulation (p < 0.01, Kuiper's test). Insets, averaged filtered unit waveforms recorded during prestimulation epochs (black) and during TES (red, superimposed). Measurements in B were performed after the rat was injected with a lethal dose of anesthetic, using the same intensity TES, which entrained the neurons. E, Estimation of effective voltage gradient. Eb, Ec, Three-shank probe placed parallel to the main current flow induced by TES electrodes. Ea, Postmortem voltage measurements at all probe sites. TES, 1.25 Hz, 1.2 V intensity. Note ∼400 μV difference between shank 1 and shank 3 (400 μm) at all depths.
Figure 6.
Figure 6.
Network state dependence of TES entrainment. A, Spectrogram of power in band-passed filtered (1–500 Hz) signal from the CA1 pyramidal layer (from the tip of one of the shanks of 4-shank silicon probe, lowered to ∼2050 μm from cortical surface). Sleep-related [alternation between slow-wave sleep (SWS) and REM epochs] and exploration-associated activity with dominant 8 Hz theta oscillation are distinguishable. Letters indicate state of vigilance defined by manual scoring. s, SWS; r, REM; e, exploration. The red boxes under the spectrum indicate stimulation trials. The color bar indicates the power in each frequency band of the time spectrum (arbitrary units). B, Zoomed epochs taken from A (blue and magenta lines) illustrate state-dependent LFP activity. TES, 1.25 Hz, 1.2 V intensity, 3-pole configuration as in Figure 1Ad. C, Example unit histograms during TES. The electrodes were moved between session 1 (0.4 V) and session 2 (1.2 V, 1.6 V, 2 V); therefore, different sets of neurons were recorded in the two sessions but neuron identity in the sleep and exploration states is the same. Note that while no unit was affected by TES during exploration, a fraction of cells were significantly entrained by TES during sleep at all intensities.

References

    1. Adey WR. Tissue interactions with nonionizing electromagnetic fields. Physiol Rev. 1981;61:435–514. - PubMed
    1. Anastassiou CA, Montgomery SM, Barahona M, Buzsáki G, Koch C. The effect of spatially inhomogeneous extracellular fields on neurons. J Neurosci. 2010;30:1925–1936. - PMC - PubMed
    1. Barker AT, Jalinous R, Freeston IL. Non-invasive magnetic stimulation of human motor cortex. Lancet. 1985;1:1106–1107. - PubMed
    1. Barthó P, Hirase H, Monconduit L, Zugaro M, Harris KD, Buzsáki G. Characterization of neocortical principal cells and interneurons by network interactions and extracellular features. J Neurophysiol. 2004;92:600–608. - PubMed
    1. Bawin SM, Sheppard AR, Mahoney MD, Adey WR. Influences of sinusoidal electric fields on excitability in the rat hippocampal slice. Brain Res. 1984;323:227–237. - PubMed

Publication types

LinkOut - more resources