Comparative Study
. 2010 Aug 25;30(34):11506-15.
doi: 10.1523/JNEUROSCI.5947-09.2010.

Periodicity and evoked responses in motor cortex

Affiliations
Comparative Study

Periodicity and evoked responses in motor cortex

Jacob Reimer et al. J Neurosci. .

Erratum in

  • J Neurosci. 2013 Jan 30;33(5):2237

Abstract

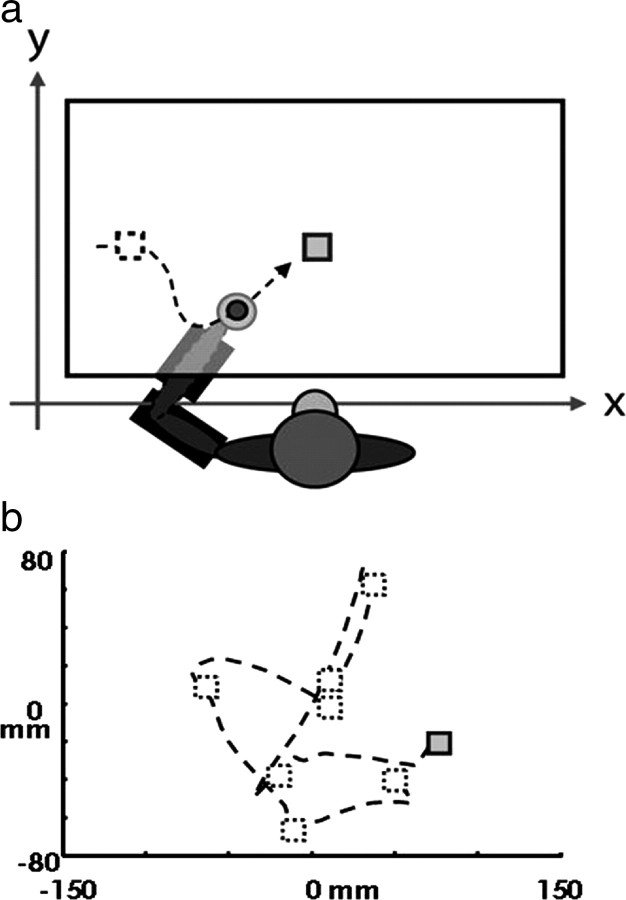
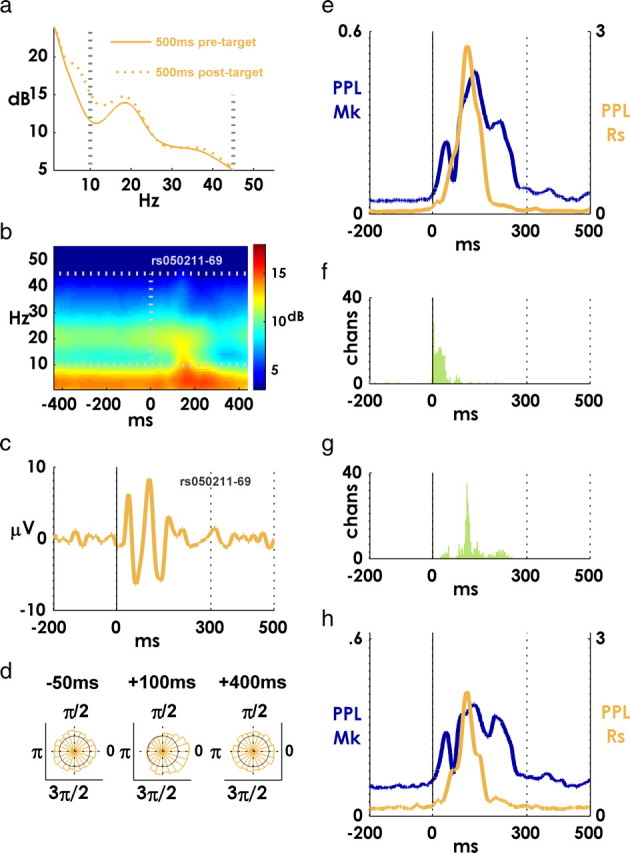
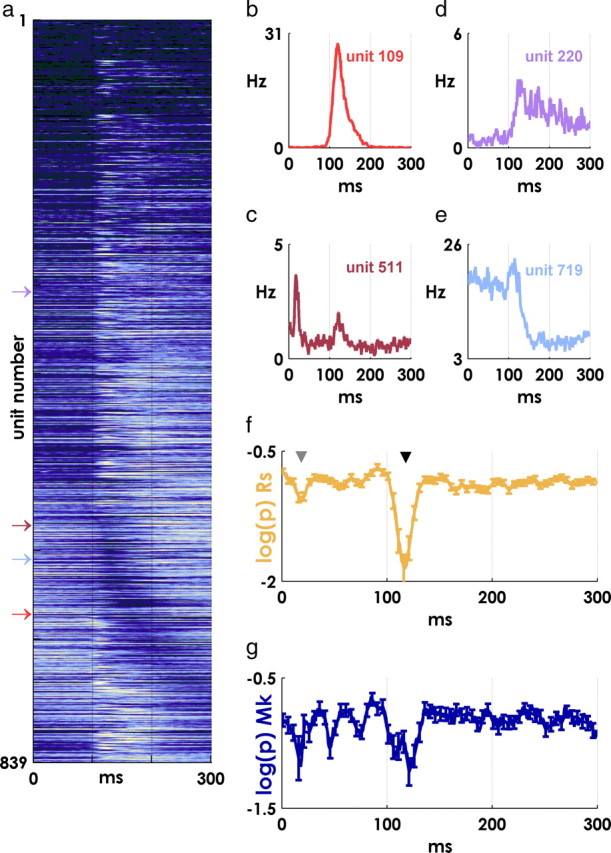
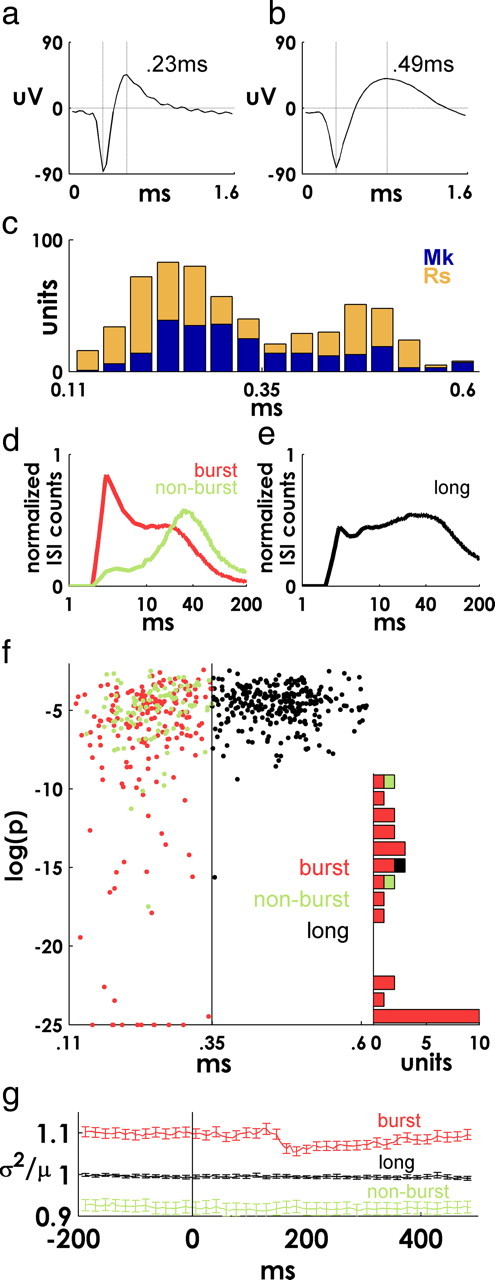
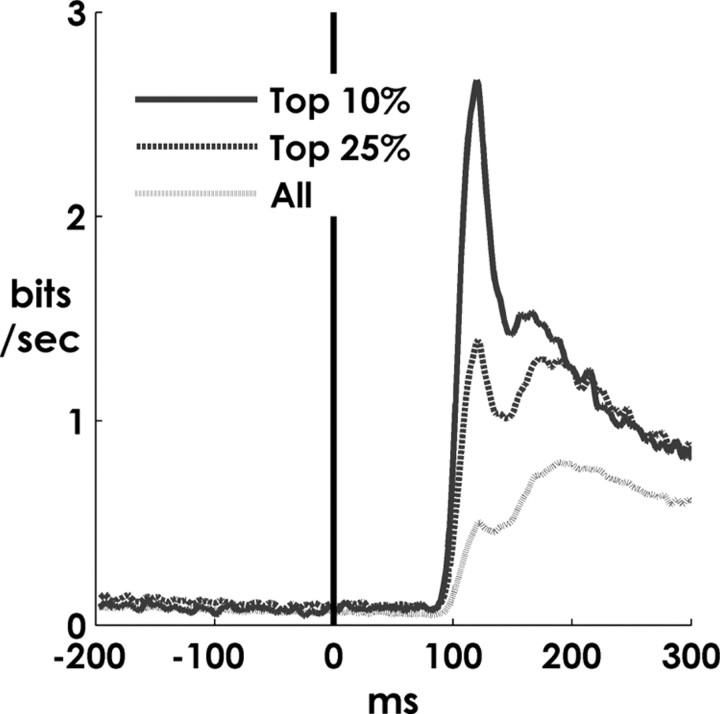
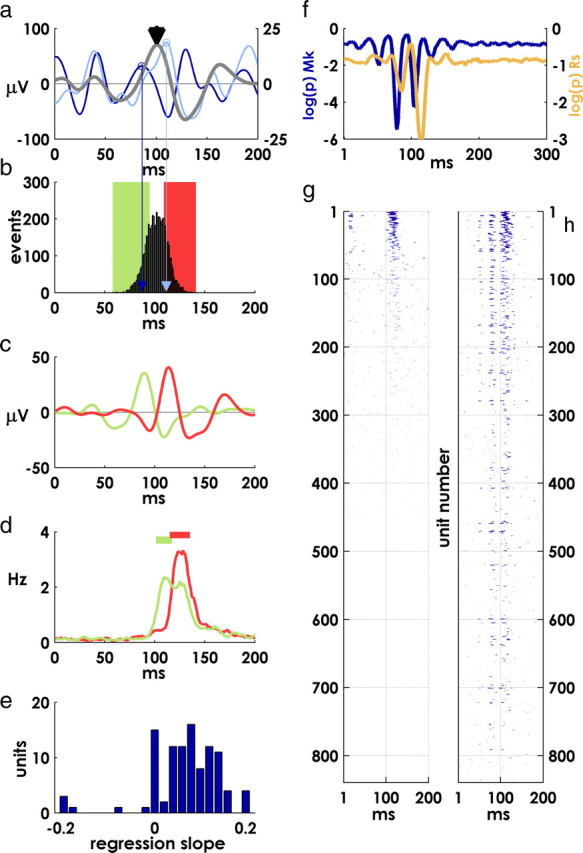
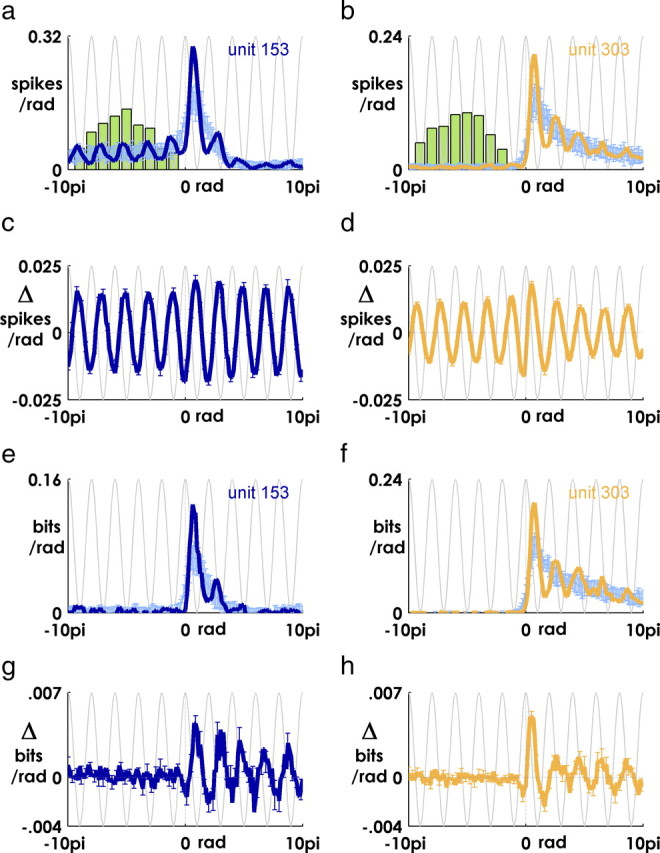
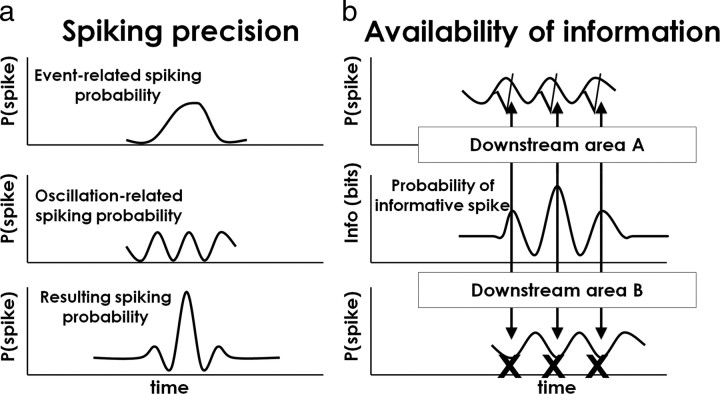
Spiking in primary motor cortex (MI) exhibits a characteristic beta frequency periodicity, but the functional relevance of this rhythmic firing is controversial. We simultaneously recorded multiple single units and local field potentials in MI in two monkeys (Macaca mulatta) during continuous, self-paced movements to serially presented targets. We find that the appearance of each new target evokes precisely timed spiking in MI at a characteristic latency but that the exact timing of this response varies depending on its relationship to the phase of the ongoing beta range oscillation. As a result of this interaction between evoked spiking and endogenous beta periodicity, we find that the amount of information about target location encoded in the spiking of MI neurons is not simply a function of elapsed time but depends also on oscillatory phase. Our results suggest that periodicity may be an important feature of the early stages of sensorimotor processing in the cortical motor system.


Figures

Figure 1.
Figure 1.
Behavioral task. a, The monkey's arm rests in a two-link robotic manipulandum below a horizontal screen. The task involves moving a cursor (filled circle) aligned to the position of his hand to the target (squares). Acquisition of each target results in the immediate appearance of a new target at a random location in the workspace (the previous target location and movement trajectory are shown with dotted lines in the figure but are not visible in the task). Arm movements are constrained in two dimensions by the manipulandum, and the position of the monkey's hand is sampled at 500 Hz. b, The monkey generates a continuous trajectory through sequential targets, receiving a juice reward every five to seven targets, and hitting several thousand targets in a typical recording session. [This figure was adapted from the study by Tkach et al. (2007).]
Figure 2.
Figure 2.
Phase-locking of beta-LFP to target appearance. a, Mean spectrum over all channels for monkey Rs. The solid line is spectrum for 400 ms preevent period, and the dotted line is the spectrum for the 400 ms postevent period. A 10–45 Hz window is indicated with vertical dotted lines. A “beta bump” in the spectrum is visible around 20 Hz. b, Perievent spectrogram for a single beta-LFP channel computed using a 128 ms Hamming window at 10 ms steps. Robust beta activity is visible throughout the perievent period. c, Mean peritarget beta-LFP for the channel in b. d, Phase distributions over all targets for the same channel in c at three perievent latencies. e, Mean PPL averaged over all channels and sessions for each monkey (blue trace and left y-axis, monkey Mk; orange trace and right y-axis, monkey Rs). The higher values indicate that the phase distribution across targets is less uniform. f, Histogram of onset latencies of phase locking (significant elevation of PPL above pretarget baseline, p < 0.001) for all channels for both monkeys. g, Histogram of PPL peak latencies for all channels for both monkeys. h, Mean PPL values over a subset of targets where the mean oscillatory amplitude stayed the same or decreased after the target appearance. The axes are the same as in e.
Figure 3.
Figure 3.
Event-related spiking. a, Mean PSTHs for all units from 0 to 300 ms after target appearance. The lighter colors indicate more activity, and the darker colors represent less firing; all PSTHs are normalized by the peak value for each unit. Units are ordered by the latency of their minimum perievent firing rate for visualization purposes. Many units display an abrupt modulation in firing at ∼100 ms after the event. b–e, Example PSTHs for four units showing the diversity of responses. The position of each unit in a is indicated by an arrow. f, Spiking precision transiently increases at characteristic latencies. Lower log(p) values at a particular latency indicate that there are more precisely timed spikes than would be expected given the background firing rate for a unit (monkey Rs; mean ± SE over all units). Two transient periods of precise spiking are visible at latencies near 15 ms (gray arrowhead) and 120 ms (black arrowhead) after the target event. g, Same result as in f for monkey Mk.
Figure 4.
Figure 4.
Functional cell classes. a, b, Examples of units with narrow and wide mean spike waveforms (see Materials and Methods). c, Superimposed (unstacked) histograms of spike waveform widths for each monkey. d, Mean normalized ISI distributions for two subsets of units with narrow spike waveforms that were bursting or nonbursting based on their ISI distribution (see Materials and Methods). e, Mean normalized ISI distributions for units with wide spike waveforms. Note logarithmic scale in d and e. f, Spike width (x-axis) versus spiking precision [minimum log(p) value] for all units. Narrow units are more precise than wide units, and bursting units tend to be more precise than nonbursting units. Values of log(p) less than −25 are plotted at −25 for visualization purposes. The right-side histogram shows the frequency of log(p) ≤ −10 for each class of units (note that bars are stacked—only a single wide waveform unit falls under this criteria). g, Mean ± SE fano factor computed in sliding 25 ms bins for each cell class, computed independently for each of 10 different target directions and then averaged.
Figure 5.
Figure 5.
Information content of perievent spiking. Mutual information between 5-ms-binned spike counts and target direction (the Cartesian direction from the location of the previous target to the location of the new target) (see Materials and Methods). The solid line is the mean information obtained from the spiking of the 10% of units that were most the precisely firing. The dashed line is mean over the 25% of units that were most precise. The gray line is mean over all units.
Figure 6.
Figure 6.
Covariation of oscillation and spike latencies and spiking precision. a, Single-channel mean beta-LFP (right y-axis, gray trace) and two examples from individual targets (left y-axis, colored traces). b, Distribution of characteristic oscillation peak times over all targets for the channel in a. Characteristic peaks are identified by proximity to the reference peak in mean LFP near 100 ms (black arrowhead in a; colored arrows indicate peak locations for single-target example traces in a). The green and red bars represent the lower and upper quartiles of the distribution. c, Averaging over the lower and upper quartiles produces an early and late mean evoked potential. d, Mean postevent firing of a unit recorded on the same electrode as the oscillation in a–c. The green and red traces are average spike rates for that unit over the lower and upper quartiles of oscillation latencies, respectively. Periods of precise spiking (p < 5 × 10⁻⁴) are indicated by horizontal lines. The latency of precise spiking mirrors the latency of the oscillation. e, Regression slopes between spike times and oscillation latencies (see Materials and Methods)—histogram of significant regression coefficients (p < 0.05). f, Subtracting LFP relative latencies from spike latencies on the same channel increases the apparent precision of postevent spiking. Log p values for each monkey after adjusting spike times by the latency of the phase-locked oscillation on the same electrode (compare with Fig. 3f,g, noting difference in scale). g, Incidence of precise spiking; mean p values for all units, thresholded at p < 0.01 before adjusting spike times. h, Thresholded mean precision of spiking as in g, after adjusting spike times as in f.
Figure 7.
Figure 7.
Information in phase-binned spikes is augmented at particular phases of the oscillation. a, b, Mean (over all targets) of phase-binned spike counts for one unit from monkey Mk (a, dark blue trace) and Rs (b, orange trace). Spike counts calculated from shuffled controls are in light blue (see Materials and Methods) (supplemental Fig. 3, available at www.jneurosci.org as supplemental material). Error bars are mean ± 2SD over 10 shuffles. The green histogram is distribution of target events. The light gray sinusoidal curve is the cosine of the phase of the oscillation. c, d, Mean difference between shuffled and unshuffled spike counts for each monkey (mean ± 2SD). e, f, Same as a and b, but y-axis is mutual information with respect to target direction (see Materials and Methods). g, h, Same as c and d, but y-axis is the difference in information between phase-binned spikes and shuffled control.
Figure 8.
Figure 8.
Summary of the effects of MI beta oscillations on spike timing and information coding. a, The interaction between event-related spiking probability (top panel) and the intrinsic periodicity in MI spiking (middle panel) produces a quasi-periodic temporal profile (bottom panel). When the target-to-target variability in the beta-LFP is accounted for, the precision of event-related spiking is increased. b, The information available in spiking varies periodically with the oscillation (middle panel). As a consequence, a downstream area (area A) oscillating coherently with the local oscillation would potentially be more receptive (check marks) at the time of more informative spiking (arrows), whereas a population oscillating out of phase (area B) would be less receptive (“X” symbols) at the times at which informative spikes are concentrated. [This figure was adapted from the study by Fries (2005).]

References

    1. Baker SN. Oscillatory interactions between sensorimotor cortex and the periphery. Curr Opin Neurobiol. 2007;17:649–655. - PMC - PubMed
    1. Baker SN, Kilner JM, Pinches EM, Lemon RN. The role of synchrony and oscillations in the motor output. Exp Brain Res. 1999;128:109–117. - PubMed
    1. Baker SN, Chiu M, Fetz EE. Afferent encoding of central oscillations in the monkey arm. J Neurophysiol. 2006;95:3904–3910. - PubMed
    1. Brovelli A, Ding M, Ledberg A, Chen Y, Nakamura R, Bressler SL. Beta oscillations in a large-scale sensorimotor cortical network: directional influences revealed by Granger causality. Proc Natl Acad Sci U S A. 2004;101:9849–9854. - PMC - PubMed
    1. Cardin JA, Carlén M, Meletis K, Knoblich U, Zhang F, Deisseroth K, Tsai LH, Moore CI. Driving fast-spiking cells induces gamma rhythm and controls sensory responses. Nature. 2009;459:663–667. - PMC - PubMed

Publication types