

Mechanisms of direction selectivity in cat primary visual cortex as revealed by visual adaptation
- PMID: 20739595
- PMCID: PMC2997030
- DOI: 10.1152/jn.00241.2010
Mechanisms of direction selectivity in cat primary visual cortex as revealed by visual adaptation
Abstract
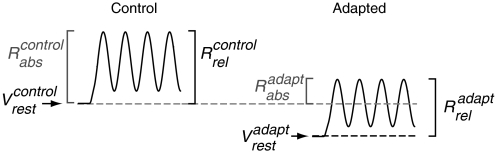
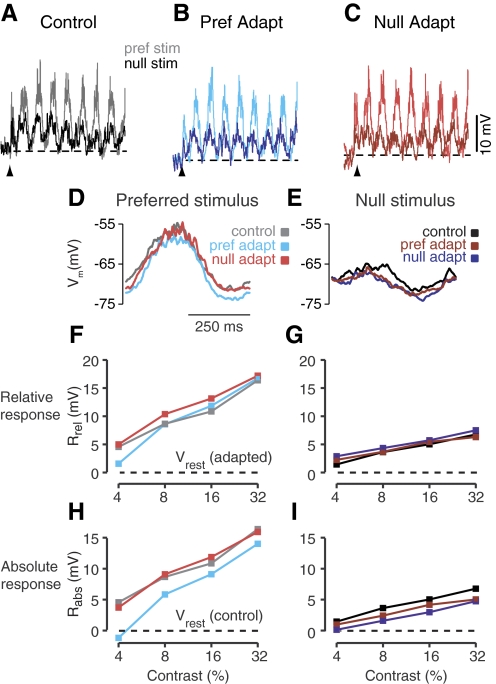
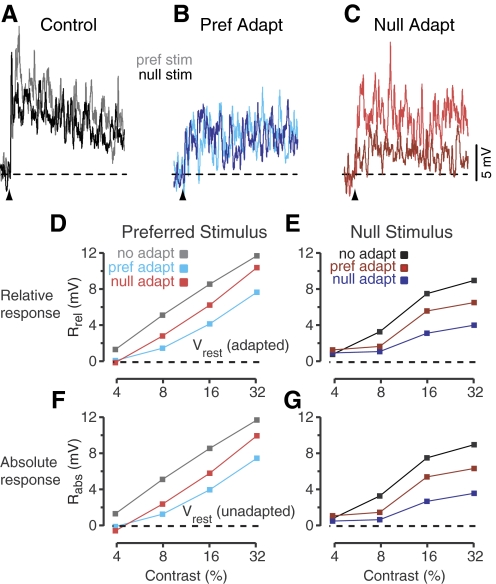
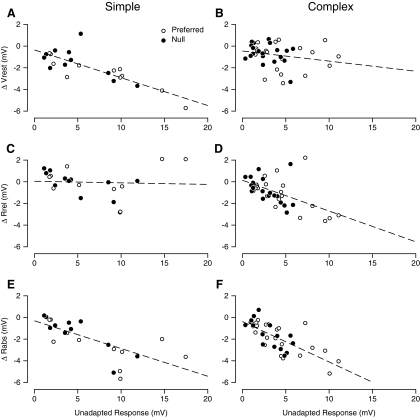
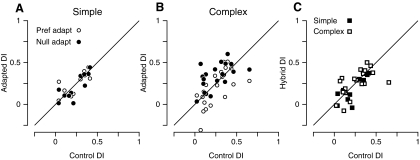
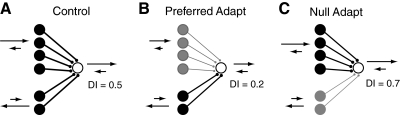
In contrast to neurons of the lateral geniculate nucleus (LGN), neurons in the primary visual cortex (V1) are selective for the direction of visual motion. Cortical direction selectivity could emerge from the spatiotemporal configuration of inputs from thalamic cells, from intracortical inhibitory interactions, or from a combination of thalamic and intracortical interactions. To distinguish between these possibilities, we studied the effect of adaptation (prolonged visual stimulation) on the direction selectivity of intracellularly recorded cortical neurons. It is known that adaptation selectively reduces the responses of cortical neurons, while largely sparing the afferent LGN input. Adaptation can therefore be used as a tool to dissect the relative contribution of afferent and intracortical interactions to the generation of direction selectivity. In both simple and complex cells, adaptation caused a hyperpolarization of the resting membrane potential (-2.5 mV, simple cells, -0.95 mV complex cells). In simple cells, adaptation in either direction only slightly reduced the visually evoked depolarization; this reduction was similar for preferred and null directions. In complex cells, adaptation strongly reduced visual responses in a direction-dependent manner: the reduction was largest when the stimulus direction matched that of the adapting motion. As a result, adaptation caused changes in the direction selectivity of complex cells: direction selectivity was reduced after preferred direction adaptation and increased after null direction adaptation. Because adaptation in the null direction enhanced direction selectivity rather than reduced it, it seems unlikely that inhibition from the null direction is the primary mechanism for creating direction selectivity.
Figures
Similar articles
-
A Computational Model of Direction Selectivity in Macaque V1 Cortex Based on Dynamic Differences between On and Off Pathways.J Neurosci. 2022 Apr 20;42(16):3365-3380. doi: 10.1523/JNEUROSCI.2145-21.2022. Epub 2022 Mar 3. J Neurosci. 2022. PMID: 35241489 Free PMC article.
-
Orientation tuning of surround suppression in lateral geniculate nucleus and primary visual cortex of cat.Neuroscience. 2007 Nov 23;149(4):962-75. doi: 10.1016/j.neuroscience.2007.08.001. Epub 2007 Aug 9. Neuroscience. 2007. PMID: 17945429
-
Temporal properties of surround suppression in cat primary visual cortex.Vis Neurosci. 2007 Sep-Oct;24(5):679-90. doi: 10.1017/S0952523807070563. Epub 2007 Aug 9. Vis Neurosci. 2007. PMID: 17686200
-
The dynamics of visual responses in the primary visual cortex.Prog Brain Res. 2007;165:21-32. doi: 10.1016/S0079-6123(06)65003-6. Prog Brain Res. 2007. PMID: 17925238 Review.
-
Mechanisms of Orientation Selectivity in the Primary Visual Cortex.Annu Rev Vis Sci. 2016 Oct 14;2:85-107. doi: 10.1146/annurev-vision-111815-114456. Annu Rev Vis Sci. 2016. PMID: 28532362 Review.
Cited by
-
Direction selectivity in the larval zebrafish tectum is mediated by asymmetric inhibition.Front Neural Circuits. 2012 Sep 4;6:59. doi: 10.3389/fncir.2012.00059. eCollection 2012. Front Neural Circuits. 2012. PMID: 22969706 Free PMC article.
-
Visual stimulation switches the polarity of excitatory input to starburst amacrine cells.Neuron. 2014 Sep 3;83(5):1172-84. doi: 10.1016/j.neuron.2014.07.037. Epub 2014 Aug 21. Neuron. 2014. PMID: 25155960 Free PMC article.
-
A power law describes the magnitude of adaptation in neural populations of primary visual cortex.Nat Commun. 2023 Dec 15;14(1):8366. doi: 10.1038/s41467-023-43572-w. Nat Commun. 2023. PMID: 38102113 Free PMC article.
-
Strengthening of Direction Selectivity by Broadly Tuned and Spatiotemporally Slightly Offset Inhibition in Mouse Visual Cortex.Cereb Cortex. 2015 Sep;25(9):2466-77. doi: 10.1093/cercor/bhu049. Epub 2014 Mar 20. Cereb Cortex. 2015. PMID: 24654259 Free PMC article.
-
fMRI repetition suppression: neuronal adaptation or stimulus expectation?Cereb Cortex. 2012 Mar;22(3):567-76. doi: 10.1093/cercor/bhr119. Epub 2011 Jun 20. Cereb Cortex. 2012. PMID: 21690262 Free PMC article.
References
-
- Borg-Graham LJ. The computation of directional selectivity in the retina occurs presynaptic to the ganglion cell. Nat Neurosci 4: 176–183, 2001 - PubMed
-
- Brainard DH. The Psychophysics Toolbox. Spat Vis 10: 443–446, 1997 - PubMed
-
- Carandini M, Ferster D. A tonic hyperpolarization underlying contrast adaptation in cat visual cortex [see comments]. Science 276: 949–952, 1997 - PubMed
Publication types
MeSH terms
Grants and funding
LinkOut - more resources
Full Text Sources
Research Materials
Miscellaneous