. 2010 Nov;104(5):2634-53.
doi: 10.1152/jn.00430.2010. Epub 2010 Aug 25.

Supplementary eye field encodes option and action value for saccades with variable reward

Affiliations

Supplementary eye field encodes option and action value for saccades with variable reward

Na-Young So et al. J Neurophysiol. 2010 Nov.

Abstract

We recorded neuronal activity in the supplementary eye field (SEF) while monkeys made saccades to targets that yielded rewards of variable amount and uncertainty of delivery. Some SEF cells (29%) represented the anticipated value of the saccade target. These neurons encoded the value of the reward option but did not reflect the action necessary to obtain the reward. A plurality of cells (45%) represented both saccade direction and value. These neurons reflect action value, i.e., the value that is expected to follow from a specific saccade. Other cells (13%) represented only saccade direction. The SEF neurons matched the monkey's risk-seeking behavior by responding more strongly to the uncertain reward options than would be expected based on their response to the sure options and the cued outcome probability. Thus SEF neurons represented subjective, not expected, value. Across the SEF population, option-value signals developed early, ∼120 ms prior to saccade execution. Action-value and saccade direction signals developed ∼60 ms later. These results suggest that the SEF is involved in transforming option-value signals into action-value signals. However, in contrast to other oculomotor neurons, SEF neurons did not reach a constant level of activity before saccade onset. Instead the activity level of many (52%) SEF neurons still reflected value at the time just before saccade initiation. This suggests that SEF neurons guide the selection of a saccade based on value information but do not participate in the initiation of that saccade.


Figures

Fig. 1.
Fig. 1.
A: sequence of events during choice trials and no-choice trials in the gambling task. Below is indicated the duration of various time periods in the gambling task. The 1st line indicates the 1st fixation period. The 2nd line indicates the uncertainty period in which the monkey has to wait for the result of the trial when he had made a saccade to a gambling option. The 3rd line indicates the delay period between visual indication of the gamble result and reward delivery. Note that the decision time between target onset and saccade initiation depends on the monkey. B: visual cues used in the gambling task: left, sure options; right, gamble options.
Fig. 2.
Fig. 2.
Localization of the supplementary eye field. A: a magnified version of the recording grid in monkey B is shown. The circles indicate the position of eye (black) and arm movement (yellow)-related neurons. The circle sizes in A indicate the number of neurons (large: 9–12 cells, medium: 5–8 cells, small: 1–4 cells). The dashed horizontal black line indicates the location of the branch of the arcuate sulcus (27.5 mm anterior to the interaural line). The 3 clusters of cells correspond to the supplementary eye filed (SEF), the presupplementary motor area (pre-SMA), and the supplementary motor area (SMA) as indicated in the margins of the recording grid. B: the section of monkey B's recording grid that contained the eye-movement-related neurons in stereotactic coordinates. The top grid indicates the location of value (V)-neurons (red circles), the middle grid the location of value-direction (VD)-neurons (green circles), and the bottom grid the location of direction (D)-neurons (blue circles). C: the section of monkey A's recording grid that contained the eye-movement-related neurons. The conventions are the same as in B. The circle sizes in B and C indicate the number of neurons (extra large: 8 cells, large: 3 cells, medium: 2 cells, small: 1 cell).
Fig. 3.
Fig. 3.
A: choice functions of monkeys A (top) and B (bottom). The probability that the monkey chooses a particular gamble option is plotted as a function of the value of the alternative sure option. The reward size is indicated as multiples of a minimal reward amount (30 μl). Left: gamble options that yield either 30 μl (1 unit) or 160 μl (4 units) with a 10% (light gray line), 50% (dark gray line), and 75% (black line) chance of receiving the larger outcome. Right: gamble options that yield either 160 μl (4 units) or 160 μl (7 units) with a 10% (light gray line), 50% (dark gray line), and 75% (black line) chance of receiving the larger outcome. B: comparison of subjective value (utility) and expected value of a gamble option. The subjective value of a gamble option was estimated from behavior and plotted against its expected value (the average amount of the 2 possible outcomes weighted by their probability). The reward size is indicated as multiples of a minimal reward amount (30 μl). The subjective value is consistently larger than the expected value, indicating that the monkey overvalued the gamble options and behaved in a risk-seeking fashion. The figure represents the grand average over all choice trials recorded from monkeys A (top) and B (bottom).
Fig. 4.
Fig. 4.
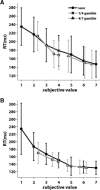
Mean reaction time in no-choice trials from monkeys A (A) and B (B). For each option, mean reaction time was plotted against the subjective value of the target. The reaction times of sure options (black circles and line), gamble options with outcomes in the lower reward range (gray squares and line), and gambles with outcomes in the higher reward range (gray triangle and line) were plotted separately. Error bars indicate 1 SD. Reaction time decreased as the subjective reward value increased. Both an increase in the range of reward amounts and in the winning probability resulted in a faster reaction time.
Fig. 5.
Fig. 5.
Rate of fixation breaks as a function of task value and time period. The histograms show the number of fixation breaks as a proportion of all recorded trials for monkey A (n = 15,005; left) and monkey B (n = 13,096; right). The trials are grouped by reward option. The rate of fixation breaks on sure option trials is indicated by the blue bars on the left hand side. The numbers 1–7 indicate multiples of the minimal fluid amount (30 μl). The rate of fixation breaks on gamble option trials before the gamble result was known is indicated by single yellow bars. The rate of fixation breaks after the gamble result was revealed is indicated by black bars in case of a loss and by red bars in case of a win. The gamble options are indicated by their possible outcomes (as multiples of the minimal fluid amount) and by their probability to win. The proportion of fixation breaks is indicated for 3 different trial periods: top, “posttarget”: between target onset and saccade onset; middle, “postsaccade”: following the end of the saccade until the gamble outcome was revealed; bottom, “postresult”: following gamble result disclosure until reward delivery.
Fig. 6.
Fig. 6.
Three SEF neurons with different degrees of value and direction-selectivity. The spike density histograms show activity during saccades in 4 directions to sure option targets, which yielded small rewards (30–60 μl; light gray), medium-sized rewards (90–150 μl; dark gray), and large rewards (180–210 μl; black). A: a neuron representing exclusively value. B: a neuron representing both direction and value. C: a neuron representing exclusively direction.
Fig. 7.
Fig. 7.
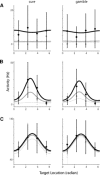
Comparison of observed neuronal activity (dot) and predicted neuronal activity (line) based on the full regression model. Neuronal activities were plotted against the 4 different target locations on screen. Left: the cases where the targets were sure options; right: the cases where the targets were gamble options. Black lines and dots represent the trials with a large reward [left: 7 sure option; right: 4/7 (win 75%) option], dark gray lines and dots represent the trials with a medium-sized reward [left: 4 sure option; right: 1/4 (win 75%) option], and light gray lines and dots represent the trials with a small reward [left: 1 sure option; right: 1/4 (win 10%) option]. Error bars indicate 1 SD. The 3 single cell examples represent V-neurons (A), VD-neurons (B), and D-neurons (C).
Fig. 8.
Fig. 8.
Comparison of the degree to which a neuron reflects saccade value or direction. Red, green, and blue dots: V-neurons, VD-neurons, and D-neurons, respectively. Remaining task-related cells that do not belong to any of those 3 functional groups are shown in gray dots. The classification of the neurons into the 3 functional groups, indicated by the color of the dots, was based on the regression analysis (A) and the information analysis (B). A: comparison of the mean information about saccade direction (ID) and value (IV) in the 100 ms before saccade onset. B: comparison of the coefficient strength of value (Vcoeff) and direction (Dcoeff) term in regression model in which those 2 terms are linearly connected. Absolute value of the coefficient was used to evaluate the degree of influence of each term.
Fig. 9.
Fig. 9.
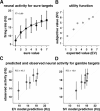
Example of a SEF neuron representing subjective, not expected, value of gamble options. A: the value-dependent regression model (Eq. 4) was constructed using only the neuronal activities in the sure option trials. Black dots, the observed mean neuronal activities. Error bars indicate 1 SD. Gray triangles and gray line, the prediction of the regression model. B: subjective vs. expected value of the gambles estimated from the monkeys choices while the neuron was recorded. The monkey was risk-seeking. C and D: comparison between predicted and observed neuronal activity for gamble targets. Mean neuronal activities from gamble option trials were compared against predicted neuronal activities from the regression model using either expected value (C) or subjective value (D) of the gamble. Error bars indicate 1 SD. The neuron was more active than predicted based on the expected reward.
Fig. 10.
Fig. 10.
SEF population represents subjective, not expected, value of gamble options. Here we plotted the distribution of the difference between residual sum of squares (RSS) from expected value-based model (RSSEV) and RSS from subjective value-based model (RSSSV). Positive value in difference means that subjective value is a better predictor of neuronal activity than expected value. Distribution of the difference was plotted among all task-related neurons (A), V-neurons (B), D-neurons (C), and VD-neurons (D).
Fig. 11.
Fig. 11.
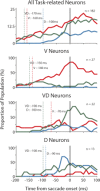
Temporal dynamics of regression terms with a significant influence on neuronal activity. For each time bin, we counted the number of cells with significant value (red), direction (blue), and value-direction interaction terms (green) in their best-fitting regression model. The number was plotted separately for all task-related neurons, V-neurons, VD-neurons, and D-neurons (from top to bottom) as a proportion of the total number of neurons in each group. Dotted lines, onset of selectivity in the population for each regression term.
Fig. 12.
Fig. 12.
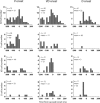
Distribution of onset of significant selectivity for value, direction, and their interaction. For each individual SEF neurons, the time bin relative to saccade onset was plotted, at which the regression function was 1st significantly influenced by value (left), value-direction interaction (middle), and direction (right). In the top row, we plotted the onset times of the 3 terms for all task-related neurons. In the next 3 columns, we plotted the onset times for the 27 V-neurons (top middle row), 22 VD-neurons (bottom middle row), and 13 D-neurons (bottom row) as classified by the regression method. For each neuronal population and regression term, we indicate the number of neurons, for which we could determine an onset time and the mean of the onset distribution.
Fig. 13.
Fig. 13.
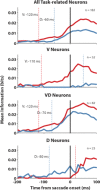
Temporal dynamics of value and direction information. For each time bin, the mean information carried by neurons was plotted. Red line, value; blue line, direction information; dotted lines, onset of information accumulation.
Fig. 14.
Fig. 14.
Neuronal activity at saccade initiation as a function of target. The 3 single cell examples represent V-neurons (A), VD-neurons (B), and D-neurons (C). The spike density histograms are aligned on saccade onset. Each column shows the activity of the same neuron sorted by target value. The saccade direction for all 5 trial groups is toward the preferred direction. The color of the spike density histogram represents the rank order of the trial groups from highest (black) to lowest (light gray) target value. Below each histogram is shown the mean activity in each trial group as a function of subjective value. Error bars indicate 1 SD. Dotted line, the linear regression.
Fig. 15.
Fig. 15.
Range of fluctuation in neuronal activity at saccade initiation for the neurons not showing a significant trend with target value. The fluctuation range for each neuron was normalized against the maximum firing rate [range = (activitymax – activitymin)/activitymax].

Similar articles

Cited by

References

    1. Brown JW, Hanes DP, Schall JD, Stuphorn V. Relation of frontal eye field activity to saccade initiation during a countermanding task. Exp Brain Res 190: 135–151, 2008 - PMC - PubMed
    1. Burnham KP, Anderson DR. Model Selection and Multimodal Inference. New York: Springer, 2002
    1. Busemeyer JR, Diederich A. Cognitive Modeling. Thousand Oaks, CA: SAGE, 2010
    1. Cisek P. Cortical mechanisms of action selection: the affordance competition hypothesis. Philos Trans R Soc Lond B Biol Sci 362: 1585–1599, 2007 - PMC - PubMed
    1. Cisek P, Kalaska JF. Neural mechanisms for interacting with a world full of action choices. Annu Rev Neurosci 33: 269–298, 2010 - PubMed

LinkOut - more resources