. 2010 Nov;104(5):2308-20.
doi: 10.1152/jn.00451.2010. Epub 2010 Aug 25.

Auditory nerve fibers excite targets through synapses that vary in convergence, strength, and short-term plasticity

Affiliations

Auditory nerve fibers excite targets through synapses that vary in convergence, strength, and short-term plasticity

Xiao-Jie Cao et al. J Neurophysiol. 2010 Nov.

Abstract

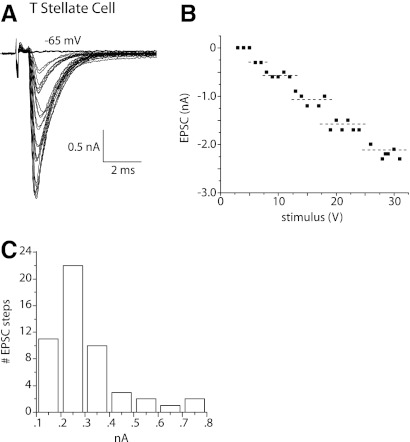
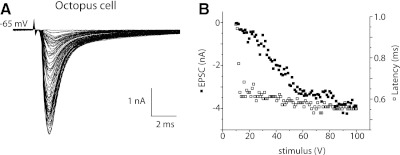
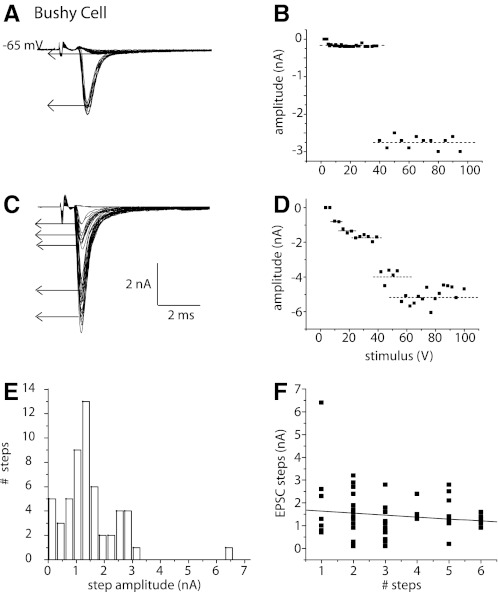
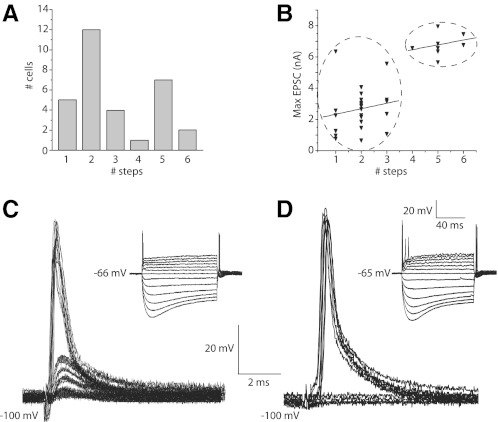
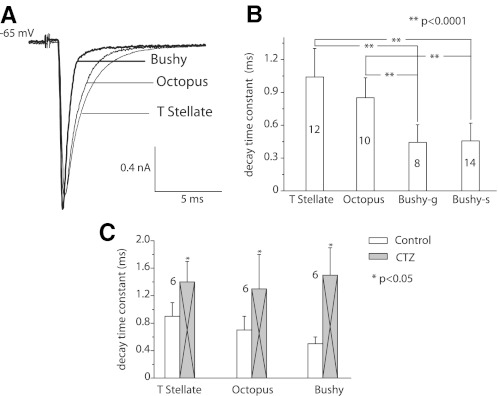
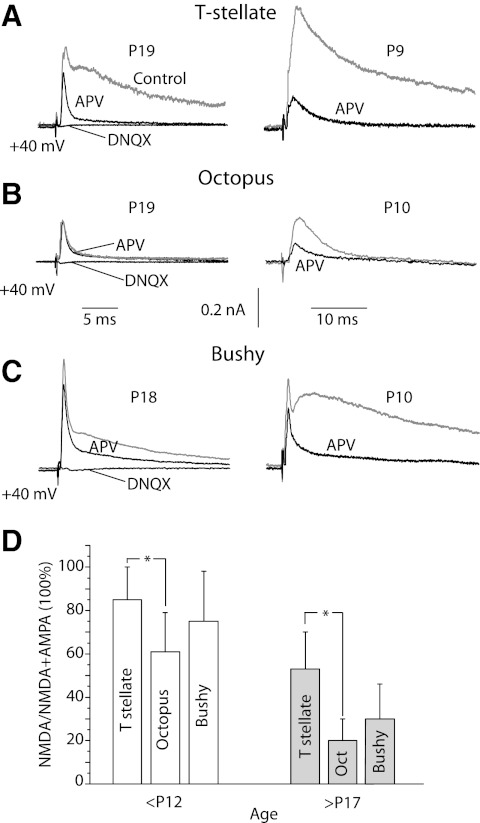
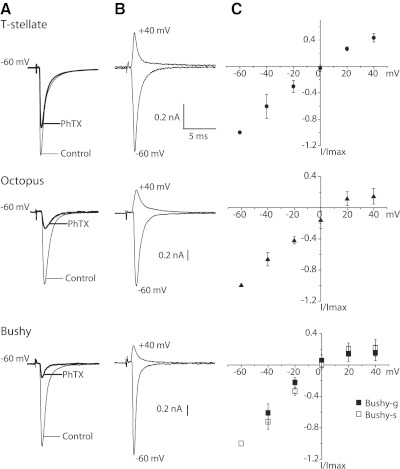
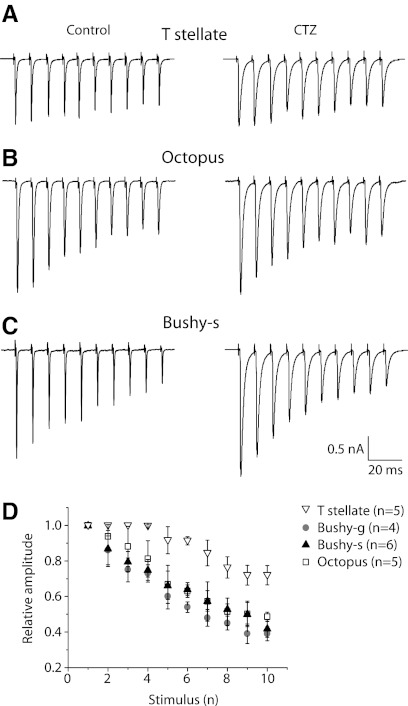
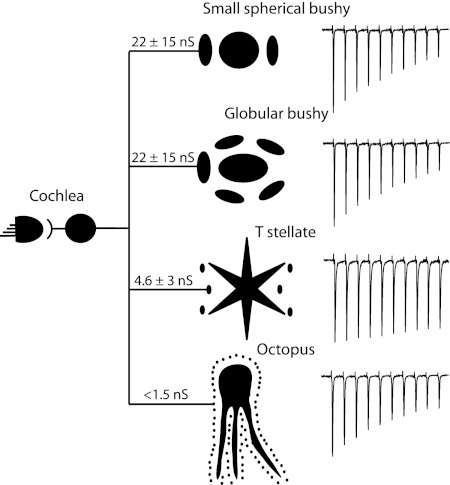
Auditory nerve fibers are the major source of excitation to the three groups of principal cells of the ventral cochlear nucleus (VCN), bushy, T stellate, and octopus cells. Shock-evoked excitatory postsynaptic currents (eEPSCs) in slices from mice showed systematic differences between groups of principal cells, indicating that target cells contribute to determining pre- and postsynaptic properties of synapses from spiral ganglion cells. Bushy cells likely to be small spherical bushy cells receive no more than three, most often two, excitatory inputs; those likely to be globular bushy cells receive at least four, most likely five, inputs. T stellate cells receive 6.5 inputs. Octopus cells receive >60 inputs. The N-methyl-d-aspartate (NMDA) components of eEPSCs were largest in T stellate, smaller in bushy, and smallest in octopus cells, and they were larger in neurons from younger than older mice. The average AMPA conductance of a unitary input is 22 ± 15 nS in both groups of bushy cells, <1.5 nS in octopus cells, and 4.6 ± 3 nS in T stellate cells. Sensitivity to philanthotoxin (PhTX) and rectification in the intracellular presence of spermine indicate that AMPA receptors that mediate eEPSCs in T stellate cells contain more GluR2 subunits than those in bushy and octopus cells. The AMPA components of eEPSCs were briefer in bushy (0.5 ms half-width) than in T stellate and octopus cells (0.8-0.9 ms half-width). Widening of eEPSCs in the presence of cyclothiazide (CTZ) indicates that desensitization shortens eEPSCs. CTZ-insensitive synaptic depression of the AMPA components was greater in bushy and octopus than in T stellate cells.


Figures

Fig. 1.
Fig. 1.
In T stellate cells, shocks to fiber bundles in the vicinity of the recorded cell body evoked excitatory postsynatic currents (EPSCs) that grew in steps with the strength of the shock. A: whole cell patch-clamp recording from a T stellate cell whose voltage was clamped at −65 mV. The artifact marks when shocks of 0.1 ms duration and variable voltage were presented. After a delay of ∼0.5 ms, an inward current was detected in the T stellate cell whose amplitude grew with the strength of shocks. Superposition of the traces indicates that the amplitude of EPSCs clustered. B: the plot of the peak amplitude of EPSCs shown in A as a function of shock strength also shows that the magnitude of EPSCs grew in steps. The dashed lines show means of each cluster determined by K-means cluster analysis. A step in the amplitude of EPSCs reflects the recruitment of at least 1 fiber and is the basis for estimating the number of excitatory inputs of the recorded cell. C: the amplitude distribution of steps in all T stellate cells (n = 11) from which measurements were made reflects the contribution of a single fiber to the synaptic current at −65 mV. The histogram is unimodal with a peak ∼0.25 nA.
Fig. 2.
Fig. 2.
In an octopus cell, shocks to fiber bundles evoked responses that were graded. A: after a synaptic delay of 0.5 ms, shocks evoked inward currents. The amplitude of EPSCs varied almost continuously with the strength of shocks. Also, the peaks of small responses occurred ∼0.3 ms later than those of larger responses. B: a plot of the peak amplitudes of EPSCs (■) as a function of shock strength. The plot of amplitudes of EPSCs confirms that responses varied almost continuously in size. The largest jump was 0.15 nA. The plot of latency to peak (□) as a function of shock strength shows that over a wide range of stimulus strengths and response amplitudes, the latency varied only within ∼0.250 ms.
Fig. 3.
Fig. 3.
In bushy cells, EPSCs grew in steps with 2 patterns. A: EPSCs in a bushy cell that was held at −65 mV grew in 2 steps, the 1st being small and the 2nd being large. B: a plot of the amplitudes of EPSCs as a function of shock strength also shows the steps. K-means cluster analysis indicated that the response grew in 2 steps. The 1st step was smaller (0.4 nA) than the 2nd (1.4 nA). C: in a different bushy cell, EPSCs grew in more steps and reached a larger maximal value. D: a plot of the growth of EPSCs as a function of shock strength reflects the presence of multiple steps. K-means cluster analysis indicates that EPSCs grew in 5 steps in this cell. E: the distribution of amplitudes of steps in EPSCs over the entire population of bushy cells from which such recordings were made (n = 30) shows that the sizes of steps were multimodal. F: there was little or no correlation between the sizes and total number of steps in bushy cells. Sizes of steps were ∼1.5 nA independent of the estimated number of inputs.
Fig. 4.
Fig. 4.
Bushy cells fall into 2 distinct groups; bushy cells that fire 1 action potential have more inputs than those that fire multiple action potentials. A: histogram of the estimated number of inputs of bushy cells is bimodal consistent with bushy cells falling into 2 groups. One group, 60%, received input from ≤3 inputs, whereas another group, 40%, received input from ≥4 fibers. B: the bushy cells that had most inputs tended to have the largest maximal EPSCs. K-means cluster analysis indicated that the amplitudes of maximal EPSCs fell into 2 groups indicated by the ovals (P < 0.05). C: bushy cell with 4 inputs fired a single action potential when depolarized with current. Synaptic responses to shocks that were increased in small increments showed 4 steps in rising slope and amplitude. Excitatory postsynaptic potentials (EPSPs) were recorded when the cell was hyperpolarized to −100 mV to increase their resolution. Under these conditions, 3 steps were subthreshold and a 4th brought the cell to threshold, giving the cell a total of at least 4 inputs. Inset: responses of the same cell to a family of current pulses from +0.6 to −0.6 nA that changed in 0.1 nA increments. The bushy cell fired only a single action potential no matter how strongly it was depolarized. D: bushy cell with 2 inputs fired 3 action potentials when depolarized with current. The slope of the foot of the EPSP in this cell grew in 2 steps as the shock strength was increased in small increments. Inset: current pulses in this bushy cell evoked 3 action potentials. The larger responses to current pulses than in C reflect a higher input resistance.
Fig. 5.
Fig. 5.
The time course of eEPSCs differed between principal cells of the ventral cochlear nucleus (VCN). A: averages of 10 responses from a bushy-s, an octopus, and a T stellate cell of nearly equal magnitudes are superimposed. The eEPSCs from the bushy cell are narrower than those of T stellate and octopus cells, whereas those of T stellate and octopus cells are similar. B: measurements from populations of cells indicate that the differences were consistent. The decay time constants associated with single exponential fits were significantly shorter in bushy than in T stellate and octopus cells (**P < 0.0001). C: after the application of 100 μM cyclothiazide (CTZ), eEPSCs decayed more slowly, indicating that desensitization of receptors sharpens the timing of synaptic excitation. The data from bushy-s and bushy-g cells were pooled as there was no detectable difference between them.
Fig. 6.
Fig. 6.
The proportion of the synaptic current that was mediated through NMDA receptors varied as a function of age and cell type. A-C: EPSCs were recorded at +40 mV in neurons from more mature mice at P18 or P19 (gray traces, left) and less mature mice (gray traces, right) in all three types of principal cells. 100 μM APV blocked the slow component of the synaptic current (dark traces). The remaining fast EPSC was blocked by 40 μM DNQX (left) D: The fraction of peak eEPSCs that is sensitive to APV was compared between cell types and in old and young mice. The difference between T stellate and bushy cells was not statistically significant but the difference between T stellate and octopus cells was (*P < 0.05). APV-sensitive currents were larger in younger than in older mice.
Fig. 7.
Fig. 7.
Two tests indicate that AMPA receptors of T stellate cells contain more GluR2 subunits than those of bushy or octopus cells. A: eEPSCs were recorded at −60 mV under control conditions. Then 30 μM kainate, which activates AMPA receptors, and 50 μM PhTX, which blocks open receptors, were applied together for ∼5 min. Measurements were made in the presence of 50 μM PhTX after kainate was washed out. Traces show averages of 15 EPSCs, evoked at 0.2 Hz. There was no systematic change in amplitude in those EPSCs, suggesting that few if any additional AMPA receptors were blocked after kainate was washed out. B: in the presence of 100 μM APV, eEPSCs were recorded from the same 3 cells as A at −60 and +40 mV. C: plots of normalized, peak eEPSCs from 5 T stellate, 3 bushy-s, 3 bushy-g, and 5 octopus cells as a function of voltage show that the amplitude of EPSCs varies linearly with voltage in the hyperpolarizing voltage range but rectify in the depolarizing voltage range. The rectification arises from the block of outward current through the AMPA receptors in the intracellular presence of 100 μM spermine, applied at eEPSCs reversed near 0 mV.
Fig. 8.
Fig. 8.
Cyclothiazide-insensitive synaptic depression was evident in EPSCs evoked by trains of shocks at 100 Hz recorded at −65 mV in all 3 types of principal cells. A: in a T stellate cell, EPSCs showed relatively little depression. B: in an octopus cell, depression was obvious. C: in a bushy-s cell, synaptic depression was also obvious. D: depression during 100 Hz trains was compared by normalizing EPSCs to the 1st EPSC of each train. The degree of synaptic depression was consistent within a cell type; depression was greater in octopus and bushy cells than in T stellate cells.
Fig. 9.
Fig. 9.
A summary of our conclusions is presented diagrammatically. Individual type I auditory nerve fibers generally receive acoustic information from 1 hair cell and innervate each of the principal cells of the VCN. The average strengths of connections vary between cells and are indicated diagrammatically in the sizes of terminals. The variability of inputs is indicated by the SD of the average conductance. Estimates of the number of auditory nerve fibers that converge on individual principal cells are indicated by the number of endings that surround the cells. Synaptic depression of synapses between auditory nerve fibers and their targets varies as shown in the trains of EPSCs on the right.

References

    1. Bal R, Baydas G, Naziroglu M. Electrophysiological properties of ventral cochlear nucleus neurons of the dog. Hear Res 256: 93–103, 2009 - PubMed
    1. Bal R, Oertel D. Hyperpolarization-activated, mixed-cation current (Ih) in octopus cells of the mammalian cochlear nucleus. J Neurophysiol 84: 806–817, 2000 - PubMed
    1. Bal R, Oertel D. Potassium currents in octopus cells of the mammalian cochlear nuclei. J Neurophysiol 86: 2299–2311, 2001 - PubMed
    1. Blackburn CC, Sachs MB. Classification of unit types in the anteroventral cochlear nucleus: PST histograms and regularity analysis. J Neurophysiol 62: 1303–1329, 1989 - PubMed
    1. Blackburn CC, Sachs MB. The representations of the steady-state vowel sound /e/ in the discharge patterns of cat anteroventral cochlear nucleus neurons. J Neurophysiol 63: 1191–1212, 1990 - PubMed

Publication types

Substances

LinkOut - more resources