. 2010 Nov;186(3):983-95.
doi: 10.1534/genetics.110.118661. Epub 2010 Aug 25.

The confounding effects of population structure, genetic diversity and the sampling scheme on the detection and quantification of population size changes

Affiliations

The confounding effects of population structure, genetic diversity and the sampling scheme on the detection and quantification of population size changes

Lounès Chikhi et al. Genetics. 2010 Nov.

Abstract

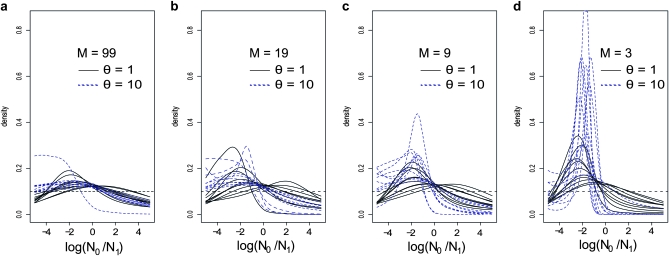
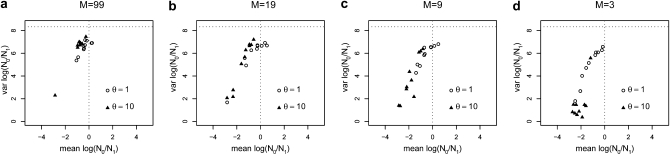
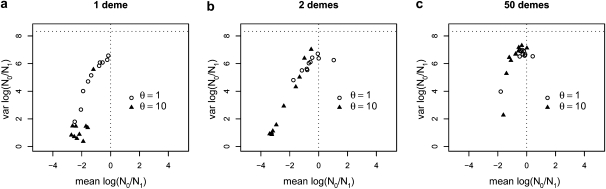
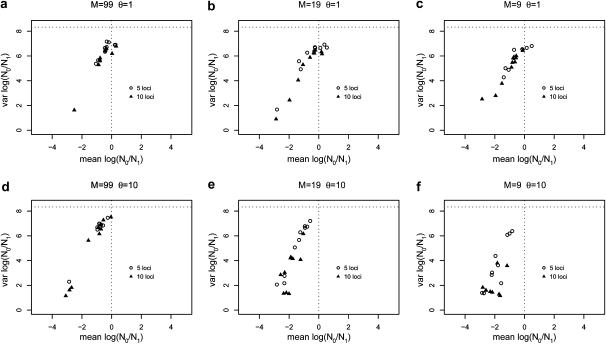
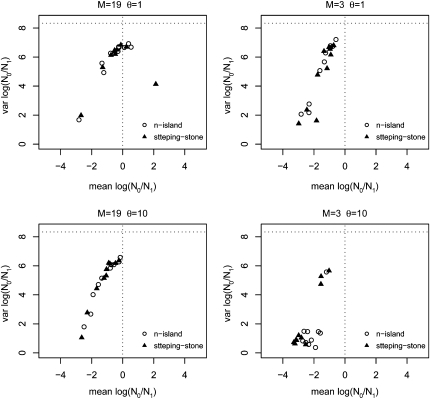
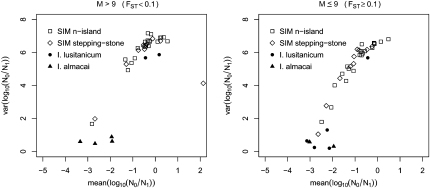
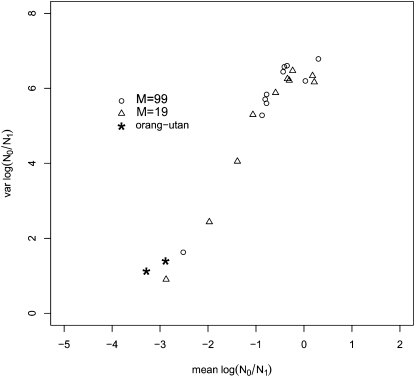
The idea that molecular data should contain information on the recent evolutionary history of populations is rather old. However, much of the work carried out today owes to the work of the statisticians and theoreticians who demonstrated that it was possible to detect departures from equilibrium conditions (e.g., panmictic population/mutation-drift equilibrium) and interpret them in terms of deviations from neutrality or stationarity. During the last 20 years the detection of population size changes has usually been carried out under the assumption that samples were obtained from populations that can be approximated by a Wright-Fisher model (i.e., assuming panmixia, demographic stationarity, etc.). However, natural populations are usually part of spatial networks and are interconnected through gene flow. Here we simulated genetic data at mutation and migration-drift equilibrium under an n-island and a stepping-stone model. The simulated populations were thus stationary and not subject to any population size change. We varied the level of gene flow between populations and the scaled mutation rate. We also used several sampling schemes. We then analyzed the simulated samples using the Bayesian method implemented in MSVAR, the Markov Chain Monte Carlo simulation program, to detect and quantify putative population size changes using microsatellite data. Our results show that all three factors (genetic differentiation/gene flow, genetic diversity, and the sampling scheme) play a role in generating false bottleneck signals. We also suggest an ad hoc method to counter this effect. The confounding effect of population structure and of the sampling scheme has practical implications for many conservation studies. Indeed, if population structure is creating "spurious" bottleneck signals, the interpretation of bottleneck signals from genetic data might be less straightforward than it would seem, and several studies may have overestimated or incorrectly detected bottlenecks in endangered species.


Figures

F<sc>igure</sc> 1.—
Figure 1.—
Influence of gene flow and genetic diversity in the detection of bottlenecks—posteriors. Posterior distributions were obtained for log10(r), where r is the ratio of present (N0) over ancient (N1) population size change. Negative and positive values of log10(r) correspond to population bottlenecks and expansions, respectively. For all analyses the prior for log10(r) was a uniform between −5 and 5 and is represented by the horizontal dashed line. The results were obtained with five loci and 50 diploid individuals sampled from a single deme assuming a 100-island model (see text for details). (a) Posteriors obtained for all the simulations performed for M = 99 (i.e., FST = 0.01) and for θ = 1 (solid lines) and θ = 10 (dashed lines). (b) Same as in a, but for M = 19 (i.e., FST = 0.05). (c) Same as in a, but for M = 9 (i.e., FST = 0.10). (d) Same as in a, but for M = 3 (i.e., FST = 0.25). Most posterior distributions are shifted to the left but are in general relatively flat for high levels of gene flow and not very different from the prior. Posteriors indicating a potential bottleneck were obtained for the lowest levels of gene flow and the highest genetic.
F<sc>igure</sc> 2.—
Figure 2.—
Influence of gene flow and genetic diversity in the detection of bottlenecks—means and variances. This figure represents on the x- and y-axes, respectively, the means and variances computed for the posterior distributions represented in Figure 1 for log10(r) where r = N0/N1. For comparison, the mean and variance of the prior are represented by the vertical and horizontal dotted lines, respectively. Negative means correspond to population bottlenecks, whereas positive means correspond to population expansions. The open circles correspond to posteriors obtained for θ = 1, whereas the triangles were obtained with θ = 10. (a) Results correspond to simulations with 5 loci and 50 diploid individuals sampled from a single deme, assuming M = 99 (average equilibrium FST = 0.01) in a 100-island model (see text for details). (b) Same as in a, for M = 19 (FST = 0.05). (c) Same as in a, for M = 9 (FST = 0.10). (d) Same as in a, for M = 3 (FST = 0.25).
F<sc>igure</sc> 3.—
Figure 3.—
Effect of the sampling scheme. The x- and y-axes are the same as in Figure 2, representing the mean and variance of the posterior distributions for log10(r) obtained for three sampling schemes and with 2 scaled mutation rates (θ = (1, 10)) and for M = 3 (FST = 0.25). The open circles correspond to posteriors obtained for θ = 1, whereas the triangles were obtained with θ = 10. In all cases, 50 diploid individuals were sampled, using 5 loci and assuming a 100-island model. (a) All individuals were sampled from the same deme. This is identical to d in Figure 2 and is represented here for comparison. (b) Same as in a, but all individuals were sampled from 2 demes (i.e., 25 individuals from each). (c) Same as in a, but individuals were sampled from 50 demes (i.e., one individual from each).
F<sc>igure</sc> 4.—
Figure 4.—
Effect of the number of loci on population size change estimates. Means and variances of the posterior distributions for log10(r) are shown for samples using 5 and 10 loci for different levels of gene flow and for the two scaled mutation rates (θ = 1 for a, b, and c; θ = 10 for d, e, and f). The results were obtained by sampling 50 diploid individuals from a single deme in a 100-island model.
F<sc>igure</sc> 5.—
Figure 5.—
Comparison of the stepping-stone and n-island models. Means and variances of the posterior distributions for log10(r) are shown for samples obtained for different levels of gene flow M = (19, 3) (FST = (0.05, 0.25) at equilibrium), and scaled mutation rates θ = (1, 10), under the n-island (open circles) and a two-dimensional stepping-stone model (solid triangles). In both cases, 50 diploid individuals sampled from a single deme and typed at 5 loci were analyzed.
F<sc>igure</sc> 6.—
Figure 6.—
Comparison of the Iberian minnow data with the simulations. Means and variances of the posterior distributions for log10(r) are shown for samples generated under different levels of gene flow M = (99, 19) (i.e., FST = (0.01, 0.05), left) and M = (9, 3) (FST = (0.10, 0.25), right) with scaled mutation rate θ = 1, under the n-island model and a two-dimensional stepping-stone model. In both cases, 50 diploid individuals sampled from a single deme and typed at five loci were analyzed. The results obtained for Iberochondrostoma lusitanicum and I. almacai in Sousa et al. (2008, 2009b) are represented by the solid circles and triangles, respectively. The FST values for the fish data were computed using the Vitalis and Couvet (2001b) method as in the original studies.
F<sc>igure</sc> 7.—
Figure 7.—
Comparison of the orangutan data with the simulations. Means and variances of the posterior distributions for log10(r) are shown for samples generated under different levels of gene flow M = (99, 19) (FST = (0.01, 0.05)) with scaled mutation rate θ = 1. In both cases, 50 diploid individuals sampled from a single deme and typed at 10 loci were analyzed.

Similar articles

Cited by

References

    1. Alves, M. J., and M. M. Coelho, 1994. Genetic variation and population subdivision of the endangered iberian cyprinid chondrostoma lusitanicum. J. Fish Biol. 44 627–636.
    1. Beaumont, M., and R. Nichols, 1996. Evaluating loci for use in the genetic analysis of population structure. Proc. R. Soc. Lond. B Biol. Sci. 263 1619–1626.
    1. Beaumont, M. A., 1999. Detecting population expansion and decline using microsatellites. Genetics 153 2013–2029. - PMC - PubMed
    1. Beaumont, M. A., 2003. a Estimation of population growth or decline in genetically monitored populations. Genetics 164 1139–1160. - PMC - PubMed
    1. Beaumont, M. A., 2003. b Conservation genetics, pp. 751–792 in Handbook of Statistical Genetics, edited by D. J. Balding, M. Bishop and C. Cannings. John Wiley & Sons, New York.

Publication types