. 2010 Sep;120(9):3179-90.
doi: 10.1172/JCI42868. Epub 2010 Aug 25.

Anaplasma phagocytophilum induces Ixodes scapularis ticks to express an antifreeze glycoprotein gene that enhances their survival in the cold

Affiliations

Anaplasma phagocytophilum induces Ixodes scapularis ticks to express an antifreeze glycoprotein gene that enhances their survival in the cold

Girish Neelakanta et al. J Clin Invest. 2010 Sep.

Abstract

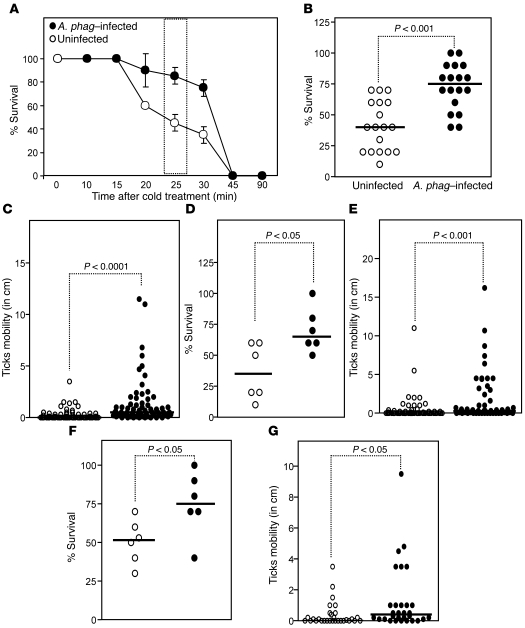
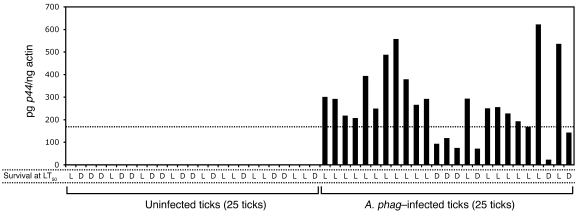
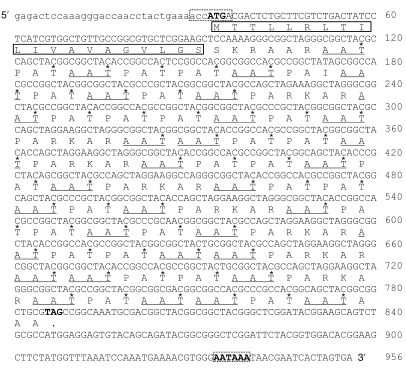
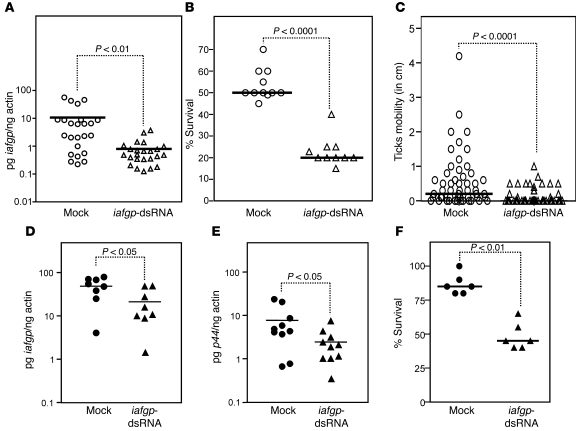
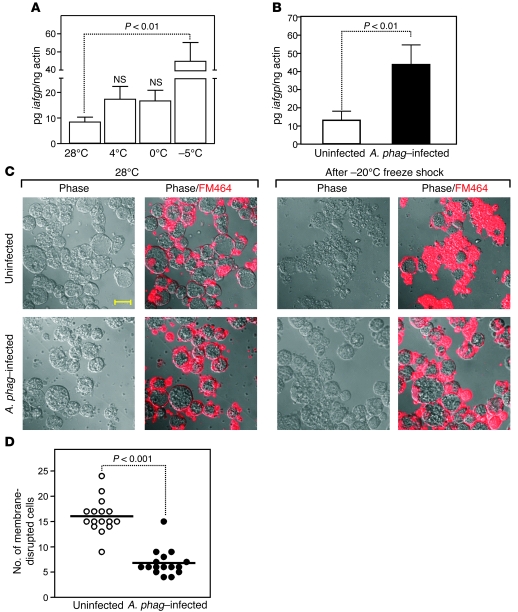
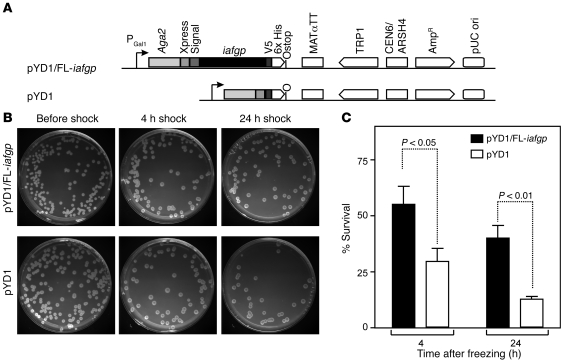
In the United States, Ixodes scapularis ticks overwinter in the Northeast and Upper Midwest and transmit the agent of human granulocytic anaplasmosis, Anaplasma phagocytophilum, among other pathogens. We now show that the presence of A. phagocytophilum in I. scapularis ticks increases their ability to survive in the cold. We identified an I. scapularis antifreeze glycoprotein, designated IAFGP, and demonstrated via RNAi knockdown studies the importance of IAFGP for the survival of I. scapularis ticks in a cold environment. Transfection studies also show that IAFGP increased the viability of yeast cells subjected to cold temperature. Remarkably, A. phagocytophilum induced the expression of iafgp, thereby increasing the cold tolerance and survival of I. scapularis. These data define a molecular basis for symbiosis between a human pathogenic bacterium and its arthropod vector and delineate what we believe to be a new pathway that may be targeted to alter the life cycle of this microbe and its invertebrate host.


Figures

Figure 1
Figure 1. A. phagocytophilum–infected nymphs survive better at cold temperatures.
(A) Survival of uninfected and A. phagocytophilum–infected (A. phag–infected) unfed nymphs at –20°C for 0, 10, 15, 20, 25, 30, 45, or 90 minutes. Data from 2 independent experiments with 10 ticks/group/time point/experiment are shown. The dashed box indicates the LT50 time point for ticks at –20°C. Mean ± SD error bars from 2 independent experiments are shown for comparison. (B) Survival of uninfected and A. phagocytophilum–infected unfed nymphs at the LT50 (–20°C, 25 minutes) from 18 independent experiments. Each circle represents 1 independent experiment (10 ticks/group/experiment). The difference in the survival between A. phagocytophilum–infected and uninfected nymphs is significant (P < 0.001). (C) Mobility (in cm) by uninfected or A. phagocytophilum–infected unfed nymphs after cold shock at LT50. Each circle represents 1 individual tick. Survival (D and F) and mobility (E and G) measurements of uninfected and A. phagocytophilum–infected unfed nymphs at LT50 in a sequential (D and E) and scrambled (F and G) cold tolerance assay. Each circle in D and F represents 1 independent experiment (10 ticks/group/experiment) and in E and G represents 1 individual tick. In all panels, white circles represent uninfected ticks and black circles represent A. phagocytophilum–infected ticks. For all panels, statistical significance was calculated using Mann-Whitney U nonparametric test. n = 70 (C); n = 60 (E); n = 30 (G) for both uninfected and A. phagocytophilum–infected ticks. Horizontal lines in BG indicate the median of the readings from independent experiment/ticks.
Figure 2
Figure 2. Increased A. phagocytophilum burden correlates with increased cold tolerance of ticks.
A. phagocytophilum-burden in Live (L) or Dead (D) A. phagocytophilum–infected unfed ticks at LT50 (–20°C, 25 minutes) as determined by QRT-PCR. Uninfected ticks were used as controls. A. phagocytophilum burden was quantified with p44 gene–specific primers and normalized to tick beta-actin levels. Histograms represent the A. phagocytophilum burden in each individual tick (25 ticks/group/assay). Horizontal dotted line in the graph points to the threshold level of A. phagocytophilum burden required to increase cold tolerance in ticks. All of the dead A. phagocytophilum–infected ticks showed reduced bacterial loads that fell below the threshold level. 1 complete set of data from 3 independent experiments is shown.
Figure 3
Figure 3. Nucleotide and predicted amino acid sequence of IAFGP.
The nucleotide sequence of the iafgp gene was obtained by sequencing PCR product cloned in the pGEMT-Easy Vector. The deduced amino acid sequence is shown as a single letter below the nucleotide sequence. The in-frame putative IAFGP translational start and stop codons are indicated in bold. The amino acid sequence corresponding to N-terminal signal peptide is boxed (solid line). Ala-Ala-Thr repeats are underlined, and several O-glycosylation sites are indicated by asterisks. Upstream nucleotide sequence obtained from sequencing additional cDNA clone is shown in lower case. The Kozak sequence at 5′ end and polyadenylation signal at 3′ end are indicated in bold letters and enclosed in dashed boxes.
Figure 4
Figure 4. Expression of iafgp is developmentally regulated and induced by cold and A. phagocytophilum.
(A) The expression of iafgp is developmentally regulated in I. scapularis ticks. Total RNA from unfed larvae (n = 10), unfed nymphs (n = 10), unfed adult males (n = 10 ticks), and unfed adult females (n = 10) was prepared in triplicate and the amount of iafgp transcripts was quantified by QRT-PCR and normalized to tick beta-actin. Error bars indicate + SD from the mean. (B) The expression of iafgp in nymphs is induced by cold temperatures. Total RNA from nymphs incubated at different temperatures (23°C, 10°C, 4°C, and 0°C) was prepared, and the iafgp transcript levels were quantified by QRT-PCR. Each circle represents 1 individual tick. The differences in iafgp levels at 4°C and 0°C in comparison with 23°C is significant (P < 0.05, Student’s t test). (C) Total RNA from uninfected nymphs (white circles) and A. phagocytophilum–infected nymphs (black circles) incubated at different temperatures (23°C, 10°C, 4°C, and 0°C) was prepared, and transcript levels of iafgp were quantified by QRT-PCR. Levels of iafgp were normalized to tick beta-actin. Each circle represents 1 individual tick. The elevated levels of iafgp transcripts in A. phagocytophilum–infected nymphs in comparison with the uninfected controls is significant at all tested temperatures (P < 0.05, Student’s t test). Horizontal lines in panels B and C indicate average of the readings from independent ticks.
Figure 5
Figure 5. Silencing of iafgp by RNAi reduces survival of ticks at cold temperatures.
(A) QRT-PCR showing reduced iafgp mRNA levels in iafgp-dsRNA–injected uninfected ticks compared with the mock-dsRNA control. (B) Survival of mock-dsRNA–injected and iafgp-dsRNA–injected ticks at the LT50 time point. (C) Mobility (in cm) by mock-dsRNA–injected and iafgp-dsRNA–injected ticks at LT50 time point (–20°C, 25 min). (AC) White circles represent mock-dsRNA–injected ticks, and white triangles represent iafgp-dsRNA–injected ticks. QRT-PCR showing reduced iafgp mRNA levels (D) and A. phagocytophilum burden (E) in mock-injected (black circles) and iafgp-dsRNA–injected (black triangles) ticks partially fed (48 hours) on A. phagocytophilum–infected mice. (F) Survival percentage at –20°C, 50-minute time point of mock-dsRNA–injected (black circles) and iafgp-dsRNA–injected (black triangles) ticks partially fed (48 hours) on A. phagocytophilum–infected mice. Each circle in A, C, D, and E represents 1 individual tick, and each circle in B and F represents 1 independent experiment with 10 ticks/group/experiment. Statistics in A, D, and E were performed using 2-tailed Student’s t test and in B, C, and F using Mann-Whitney U test. n = 60 (C) for both mock and iafgp-dsRNA ticks. Horizontal lines in A, D, and E represent average and in B, C, and F represent median of the readings from independent experiments/ticks.
Figure 6
Figure 6. A. phagocytophilum infection and induction of iafgp expression enhances cold tolerance in tick cells.
(A) QRT-PCR showing the levels of iafgp transcripts in tick cells incubated at different temperatures (28°C, 4°C, 0°C, –5°C). (B) QRT-PCR showing the level of iafgp transcripts in uninfected (white bar) and A. phagocytophilum–infected (black bar) tick cells at 48 hours after infection. Results from 3 independent experiments are shown. Error bars indicate + SD from the mean. The level of iafgp transcripts was normalized to tick beta-actin. (C) Immunofluorescence images of tick cells stained with FM4-64 dye showing increased membrane disruption in uninfected cells in comparison with A. phagocytophilum–infected cells after cold shock at –20°C for 10 minutes. Uninfected and A. phagocytophilum–infected tick cells incubated at 28°C served as experimental controls. Representative images from 3 independent experiments are shown. Original magnification, ×65. Scale bar: 20 μM. (D) Quantitative assessment of the number of membrane-disrupted cells in uninfected (white circles) and A. phagocytophilum–infected (black circles) tick cells after cold shock at –20°C for 10 minutes is shown. Each circle represents 1 microscopic field. Statistics were performed using Student’s t test and the P values are shown. Horizontal lines in the graph indicate average of the readings from independent microscopic observations.
Figure 7
Figure 7. IAFGP increases cold tolerance in yeast.
(A) Schematic representation of the constructs used for testing IAFGP expression in yeast cells. Full-length iafgp (FL-iafgp) was cloned in frame with AGA2 in pYD1 vector and transformed into EBY100 yeast cells. (B) Representative images from 3 independent experiments of SDGAA plates containing pYD1/FL-iafgp and the pYD1 empty vector transformed yeast cells before and after 4 hours or 24 hours at –20°C. (C) Quantitative survival assessment of pYD1/FL-iafgp (black bars) and pYD1 empty vector (white bars) transformed yeast cells after 4 hours or 24 hours at –20°C. Data from 3 independent experiments with triplicate clones are shown. Error bars indicate + SD from the mean value. Statistics were performed using Student’s t test, and the P values are shown.

Comment in

References

    1. Braendle C, Miura T, Bickel R, Shingleton AW, Kambhampati S, Stern DL. Developmental origin and evolution of bacteriocytes in the aphid-Buchnera symbiosis. . PLoS Biol. 2003;1(1):E21. - PMC - PubMed
    1. Bandi C, Dunn AM, Hurst GD, Rigaud T. Inherited microorganisms, sex-specific virulence and reproductive parasitism. Trends Parasitol. 2001;17(2):88–94. doi: 10.1016/S1471-4922(00)01812-2. - DOI - PubMed
    1. Herbert EE, Goodrich-Blair H. Friend and foe: the two faces of Xenorhabdus nematophila. . Nat Rev Microbiol. 2007;5(8):634–646. doi: 10.1038/nrmicro1706. - DOI - PubMed
    1. Dale C, Moran NA. Molecular interactions between bacterial symbionts and their hosts. Cell. 2006;126(3):453–465. doi: 10.1016/j.cell.2006.07.014. - DOI - PubMed
    1. Kikuchi Y, Hosokawa T, Fukatsu T. Insect-microbe mutualism without vertical transmission: a stinkbug acquires a beneficial gut symbiont from the environment every generation. Appl Environ Microbiol. 2007;73(13):4308–4316. doi: 10.1128/AEM.00067-07. - DOI - PMC - PubMed

Publication types

Substances