. 2010 Sep;120(9):3161-6.
doi: 10.1172/JCI43466. Epub 2010 Aug 25.

Hyposecretion of fluid from tracheal submucosal glands of CFTR-deficient pigs

Affiliations

Hyposecretion of fluid from tracheal submucosal glands of CFTR-deficient pigs

Nam Soo Joo et al. J Clin Invest. 2010 Sep.

Abstract

Cystic fibrosis (CF) results from mutations that disrupt CF transmembrane conductance regulator (CFTR), an anion channel found mainly in apical membranes of epithelial cells. CF leads to chronic infection of the airways with normally innocuous bacteria and fungi. Hypotheses to explain the pathophysiology of CF airways have been difficult to test because mouse models of CF do not develop human-like airway disease. The recent production of pigs lacking CFTR and pigs expressing the most common CF-causing CFTR mutant, DeltaF508, provide another model that might help clarify the pathophysiology of CF airway disease. Here, we studied individual submucosal glands from 1-day-old piglets in situ in explanted tracheas, using optical methods to monitor mucus secretion rates from multiple glands in parallel. Secretion rates from control piglets (WT and CFTR+/-) and piglets with CF-like disease (CFTR-/- and CFTR-/DeltaF508) were measured under 5 conditions: unstimulated (to determine basal secretion), stimulated with forskolin, stimulated with carbachol, stimulated with substance P, and, as a test for synergy, stimulated with forskolin and a low concentration of carbachol. Glands from piglets with CF-like disease responded qualitatively to all agonists like glands from human patients with CF, producing virtually no fluid in response to stimulation with forskolin and substantially less in response to all other agonists except carbachol. These data are a step toward determining whether gland secretory defects contribute to CF airway disease.


Figures

Figure 1
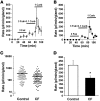
Figure 1. CF piglet glands show near-complete loss of Fsk-stimulated fluid secretion.
(A) Example of mucus bubbles under oil, produced by 30 minutes’ stimulation with 3 μM Fsk in a WT or CF piglet trachea. Arrows denote selected mucus bubbles (19 in the WT field and 7 unambiguous bubbles in the CF field). Scale bars: 0.5 mm. (B) Representative plot of cumulative mucus volume as a function of time and stimulation with 3 μM Fsk for 12 glands in the trachea of a 1-day-old WT piglet. This is the same preparation shown in part in A. Inset shows near-0 response of 15 glands from a 1-day-old CF piglet. Fsk stimulation is represented by horizontal bars. (C) Secretory response rates for all glands tested with 3 μM Fsk. Each symbol represents a single gland; horizontal bars denote means of 104 control (median, 37.2 pl/min/gland) and 107 CF (median, 0 pl/min/gland) glands. Only 19 CF glands had measurable secretion in response to Fsk; 88 did not respond to Fsk, but were detected by their responses to subsequent stimulation. (D) Summary data for control and CF piglets tested with 3 μM Fsk (10–15 glands each; n = 9 per group). *P = 0.0002.
Figure 2
Figure 2. CF piglet glands secrete less fluid in a synergy paradigm (3 μM Fsk plus 0.1 μM carbachol).
(A and B) Cumulative mucus volume as a function of time and stimulation from 12 glands of a 1-day-old WT piglet (A) and 9 glands of a 1-day-old CF piglet (B). Stimulation by the indicated agonists is represented by horizontal bars. In A, carbachol was below threshold at 0.05 and 0.1 μM. (C) Secretion rates for all glands tested with 3 μM Fsk plus 0.1 μM carbachol. Each symbol represents a single gland; horizontal bars denote means for 101 control (median, 95.4 pl/min/gland) and 110 CF (median, 21.4 pl/min/gland) glands. (D) Summary data for 9 control and 9 CF piglets tested with 3 μM Fsk plus 0.1 μM carbachol (7 CFTR–/– and 2 CFTR–/ΔF508). *P = 0.007.
Figure 3
Figure 3. Responses to SubP.
(A and B) Mean cumulative mucus volume from 7–9 control glands of a 1-day-old CFTR+/– piglet (A) and 3–9 glands of a 1-day-old CFTR–/ΔF508 piglet (B). Stimulation by the indicated agonists is represented by horizontal bars. (C) Secretory response rates for all glands tested with 1 μM SubP. Each symbol represents a single gland; horizontal bars denote means for 49 control (median, 90.1 pl/min/gland) and 48 CF (median, 23.4 pl/min/gland) glands. All glands had been previously tested with Fsk and low-dose carbachol; the response to SubP alone was not tested in these experiments. (D) Summary data for 4 control and 5 CF piglets tested with 1 μM SubP. *P = 0.014.
Figure 4
Figure 4. Responses to carbachol.
(A and B) Average secretion rates as a function of time and stimulation for 3 glands in the trachea of a 1-day-old WT piglet (A) and from 8 glands in a CF piglet (B). Stimulation by the indicated agonists is represented by horizontal bars. (C) Secretory response rates for all glands tested with 1 μM carbachol. Each symbol represents a single gland; horizontal bars denote means for 93 control (median, 236.2 pl/min/gland) and 119 CF (median, 130.3 pl/min/gland) glands. Data included glands previously tested with other agonists (controls, 51 glands, n = 6; CF, 95 glands, n = 10) as well as glands tested with 1 μM carbachol alone (WT, 42 glands, n = 3; CF, 24 glands, n = 2). Responses were usually larger in both control and CF animals when carbachol was tested alone. (D) Summary data for 6 control and 10 CF piglets tested with 1 μM carbachol. *P = 0.038.
Figure 5
Figure 5. Summary data for all 5 conditions.
Inset shows basal secretion rates with expanded rate axis: control (white bars), CF (black bars), and CF corrected for decreased gland volume (CF-c; gray bars). *P < 0.05 vs. controls. P values for size-corrected CF data versus control were as follows: basal, P = 0.19; 3 μM Fsk, P < 0.0005; synergy of 3 μM Fsk and 0.1 μM carbachol, P < 0.05; 1 μM SubP, P < 0.05; 1 μM carbachol, P = 0.26.

Comment in

References

    1. Rowe SM, Miller S, Sorscher EJ. Cystic fibrosis. . N Engl J Med. 2005;352(19):1992–2001. doi: 10.1056/NEJMra043184. - DOI - PubMed
    1. Rogers CS, et al. Production of CFTR-null and CFTR-DeltaF508 heterozygous pigs by adeno-associated virus-mediated gene targeting and somatic cell nuclear transfer. J Clin Invest. 2008;118(4):1571–1577. doi: 10.1172/JCI34773. - DOI - PMC - PubMed
    1. Rogers CS, et al. The porcine lung as a potential model for cystic fibrosis. Am J Physiol Lung Cell Mol Physiol. 2008;295(2):L240–L263. doi: 10.1152/ajplung.90203.2008. - DOI - PMC - PubMed
    1. Rogers CS, et al. Disruption of the CFTR gene produces a model of cystic fibrosis in newborn pigs. Science. 2008;321(5897):1837–1841. doi: 10.1126/science.1163600. - DOI - PMC - PubMed
    1. Stoltz DA, et al. Cystic fibrosis pigs develop lung disease and exhibit defective bacterial eradication at birth. Sci Transl Med. 2010;2(29):29ra31. - PMC - PubMed

Publication types